


Alibaba Group (BABA) Share Price Rises Over 30% Since Early September
FXOpen

As shown on the Alibaba Group (BABA) stock chart, the price surpassed $107 on the NYSE on Friday, after trading below $85 at the start of the month.
Bullish sentiment surrounding Chinese stocks is driven by the authorities' plans to stimulate the country's economy:
→ According to Benzinga, China’s Central Bank shared plans last week to lower the banks’ required reserve ratio (RRR);
→ The Central Bank also outlined further support measures for the struggling real estate market.
It appears that market participants expect these economic stimulus measures to benefit Alibaba Group (BABA).
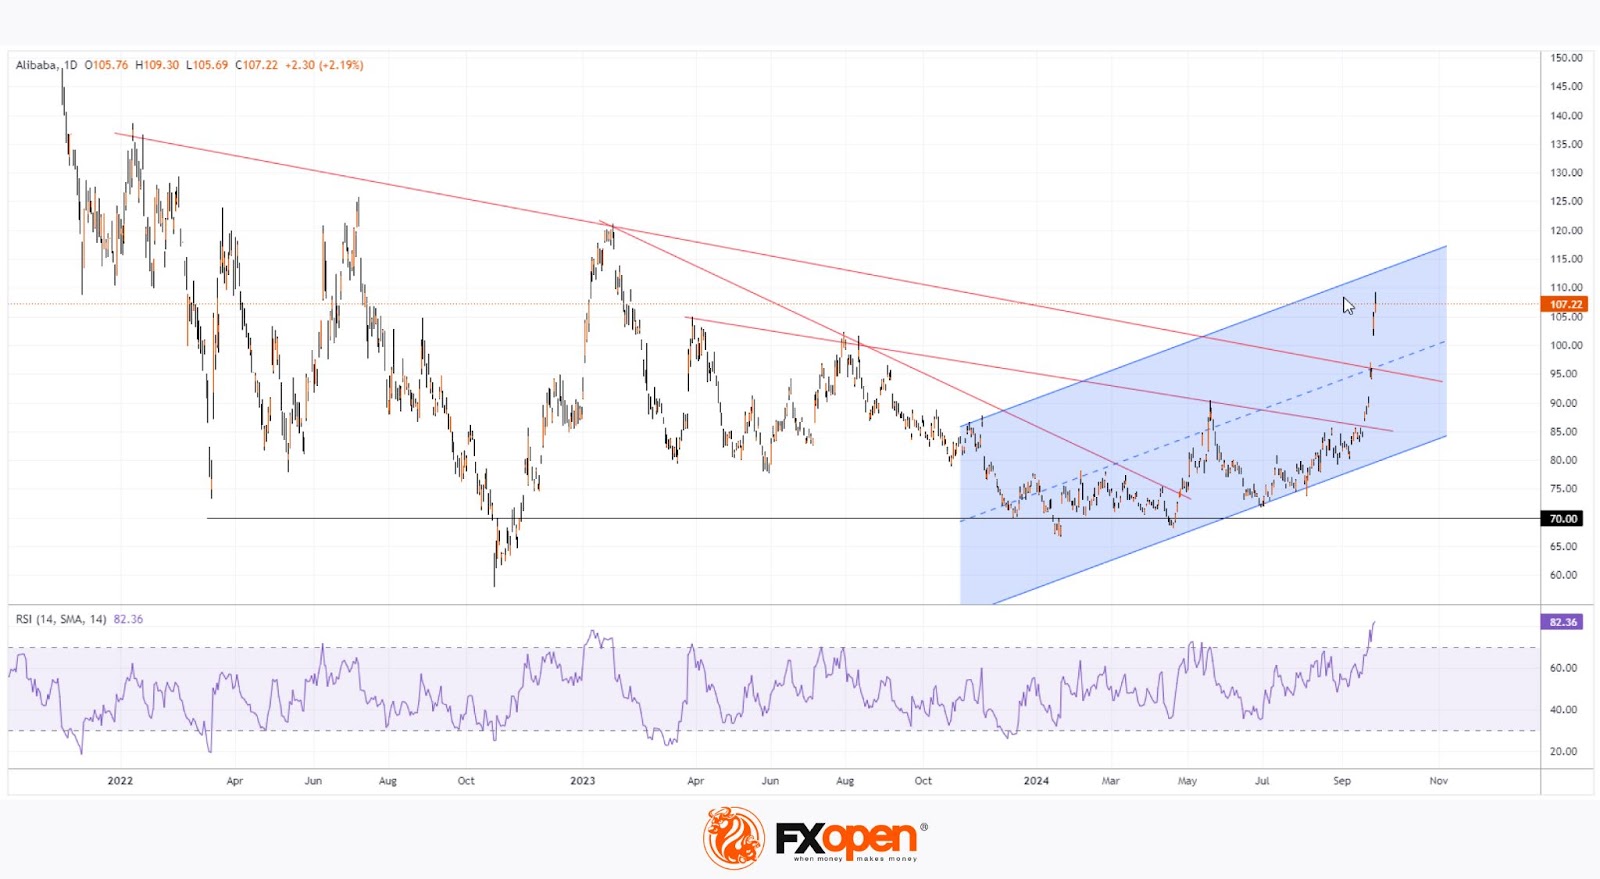
Technical analysis of the Alibaba Group (BABA) stock chart reveals:
→ The historical high above $300 was reached in October 2020, after which bears dominated the market. Signs of bullish activity emerged between 2022 and 2024 as the stock fell to $70.
→ In 2024, the price broke through three descending trendlines (marked in red) drawn through key highs, and the price movements suggest a new upward channel is forming (marked in blue).
→ The RSI indicator is at a multi-month high, signalling strong overbought conditions, while Friday’s candle closed with a long upper wick (a sign of increased bearish activity).
Although the current bullish momentum may still have room to lift Alibaba Group (BABA) shares to the upper boundary of the blue channel, given the information above, there is a significant likelihood of a correction forming in early October.
Buy and sell stocks of the world's biggest publicly-listed companies with CFDs on FXOpen’s trading platform. Open your FXOpen account now or learn more about trading share CFDs with FXOpen.
This article represents the opinion of the Companies operating under the FXOpen brand only. It is not to be construed as an offer, solicitation, or recommendation with respect to products and services provided by the Companies operating under the FXOpen brand, nor is it to be considered financial advice.
Stay ahead of the market!
Subscribe now to our mailing list and receive the latest market news and insights delivered directly to your inbox.


Latest articles

AUD/CAD: Months of Indecision — Is a Breakout Finally Coming?
The Australian dollar has clawed back most of its end-of-June losses, when it touched three-month lows against the greenback amid escalating Middle East tensions. Since then, sentiment has improved: the RBA's Assistant Governor Sarah Hunter signalled the board stands ready

USD/JPY: Battling at the Top of the Triangle
On 3 July, Japan's Finance Minister, Satsuki Katayama, stated that the Ministry of Finance remains in close contact with US authorities regarding developments in USD/JPY as the yen traded near its weakest level in almost 40 years. Similar verbal

Dow Jones (DJIA): Consolidation Beyond the Trend
Federal Reserve Chair Kevin Warsh testified before Congress on 14–15 July, reaffirming the Fed's commitment to bringing inflation back to target while providing no clear guidance on the future path of interest rates. Meanwhile, June inflation data came in