


Alibaba Group (BABA) Stock Reaches Over Two-Month High
FXOpen

As shown on the BABA stock chart, the price today has risen to around $80.80—its highest level this summer.
The primary driver of bullish sentiment is the anticipation of a positive earnings report from Alibaba Group Holding Ltd for Q2 2024, set to be released on 15th August.
According to Dow Jones Newswires:
→ Lazada, a subsidiary of Alibaba Group, has reached a certain level of profitability, which is a promising sign for the tech giant as it seeks to boost international sales amid slowing growth in China.
→ Alibaba’s market share has stabilised after a decline in 2021. DBS analysts Sachin Mittal and Andy Yeo note that the Gross Merchandise Value (GMV) of goods sold on Taobao and Tmall has returned to double-digit growth, and Alibaba’s international e-commerce platforms could become a key driver, with an estimated compound annual growth rate of 23% from FY2024 to FY2027. DBS maintains its buy recommendation for Alibaba shares.
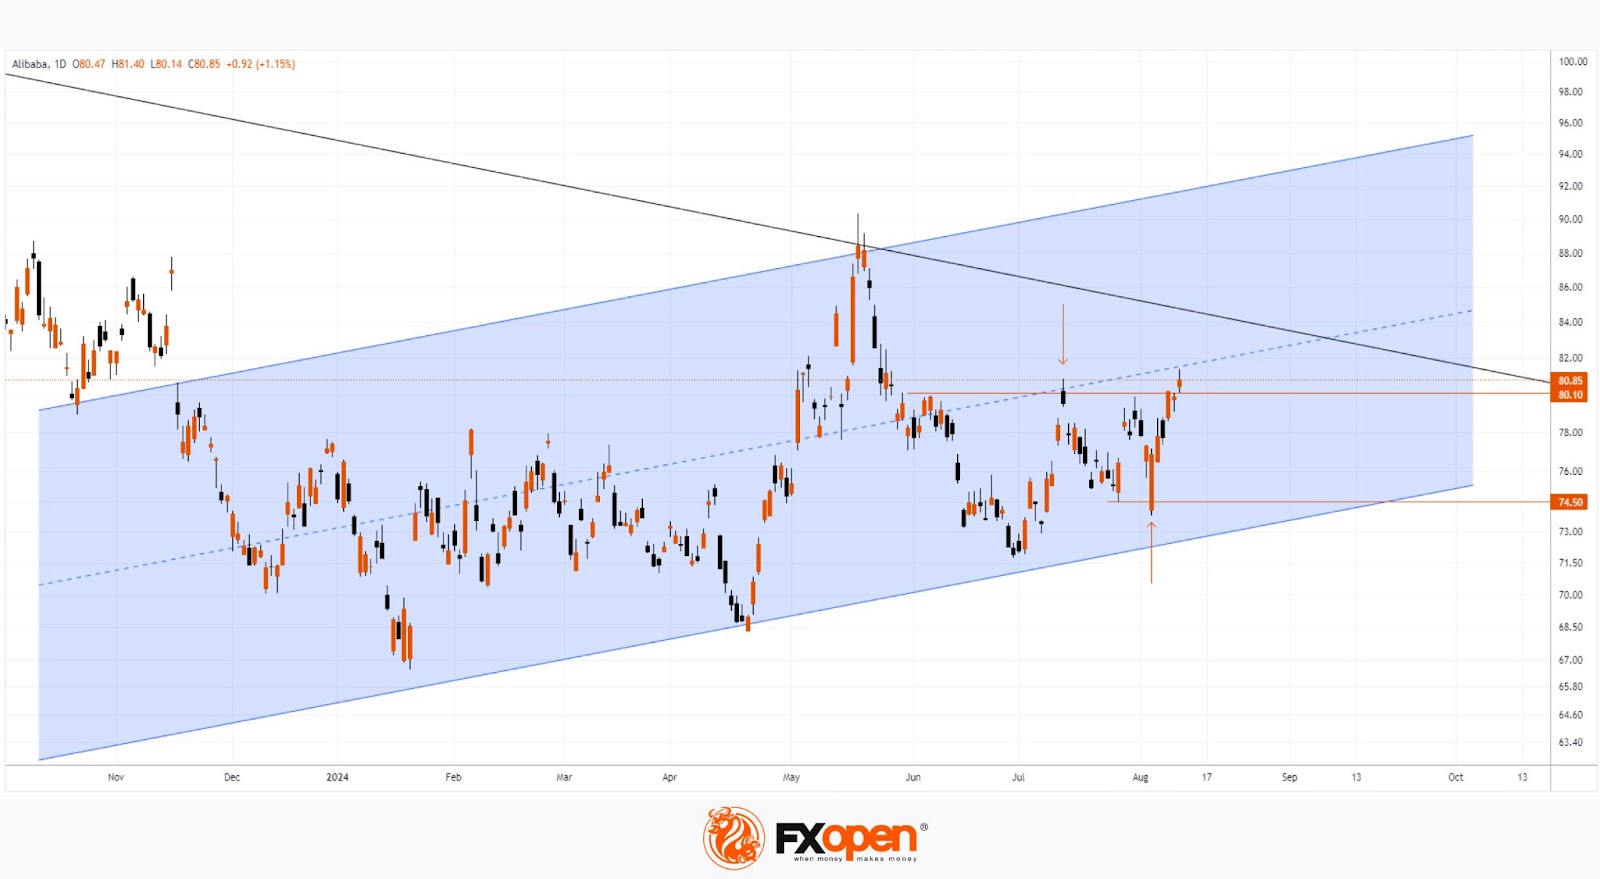
Technical analysis of the Alibaba (BABA) stock chart shows that:
→ The price is forming an ascending channel (shown in blue) and has already risen to its median line. However, it remains under pressure from a descending trendline that has been in place since 2023.
→ The chart shows patterns of false breakouts (marked with arrows) of previous local highs. It’s possible that a similar pattern (with a return below the psychological level of $80.00) could occur before the report is released.
Be prepared for sharp movements in Alibaba Group (BABA) stock around the time of the report’s publication. It could either meet bullish expectations or deliver a bearish surprise.
Buy and sell stocks of the world's biggest publicly-listed companies with CFDs on FXOpen’s trading platform. Open your FXOpen account now or learn more about trading share CFDs with FXOpen.
This article represents the opinion of the Companies operating under the FXOpen brand only. It is not to be construed as an offer, solicitation, or recommendation with respect to products and services provided by the Companies operating under the FXOpen brand, nor is it to be considered financial advice.
Stay ahead of the market!
Subscribe now to our mailing list and receive the latest market news and insights delivered directly to your inbox.


Latest articles

AI Valuations Are Back in the Spotlight
Artificial intelligence remains the dominant investment theme of 2026, but investors are increasingly questioning whether AI stock valuations are keeping pace with reality.
💰 Big Tech continues to invest at an unprecedented scale, with hyperscaler AI spending projected to exceed $800

AUD/CAD: Months of Indecision — Is a Breakout Finally Coming?
The Australian dollar has clawed back most of its end-of-June losses, when it touched three-month lows against the greenback amid escalating Middle East tensions. Since then, sentiment has improved: the RBA's Assistant Governor Sarah Hunter signalled the board stands ready

USD/JPY: Battling at the Top of the Triangle
On 3 July, Japan's Finance Minister, Satsuki Katayama, stated that the Ministry of Finance remains in close contact with US authorities regarding developments in USD/JPY as the yen traded near its weakest level in almost 40 years. Similar verbal