


Amazon Stock (AMZN) Holds Above $200
FXOpen

On Thursday, October 31, Amazon released its Q3 earnings report:
→ Earnings per share: actual = $1.43, forecast = $1.14;
→ Gross sales: actual = $158.8 billion, forecast = $157.2 billion.
The report exceeded analyst expectations, with additional optimism driven by Trump’s victory and a Fed rate cut, pushing Amazon’s stock price past the psychological $200 mark and reaching a new high above $210.
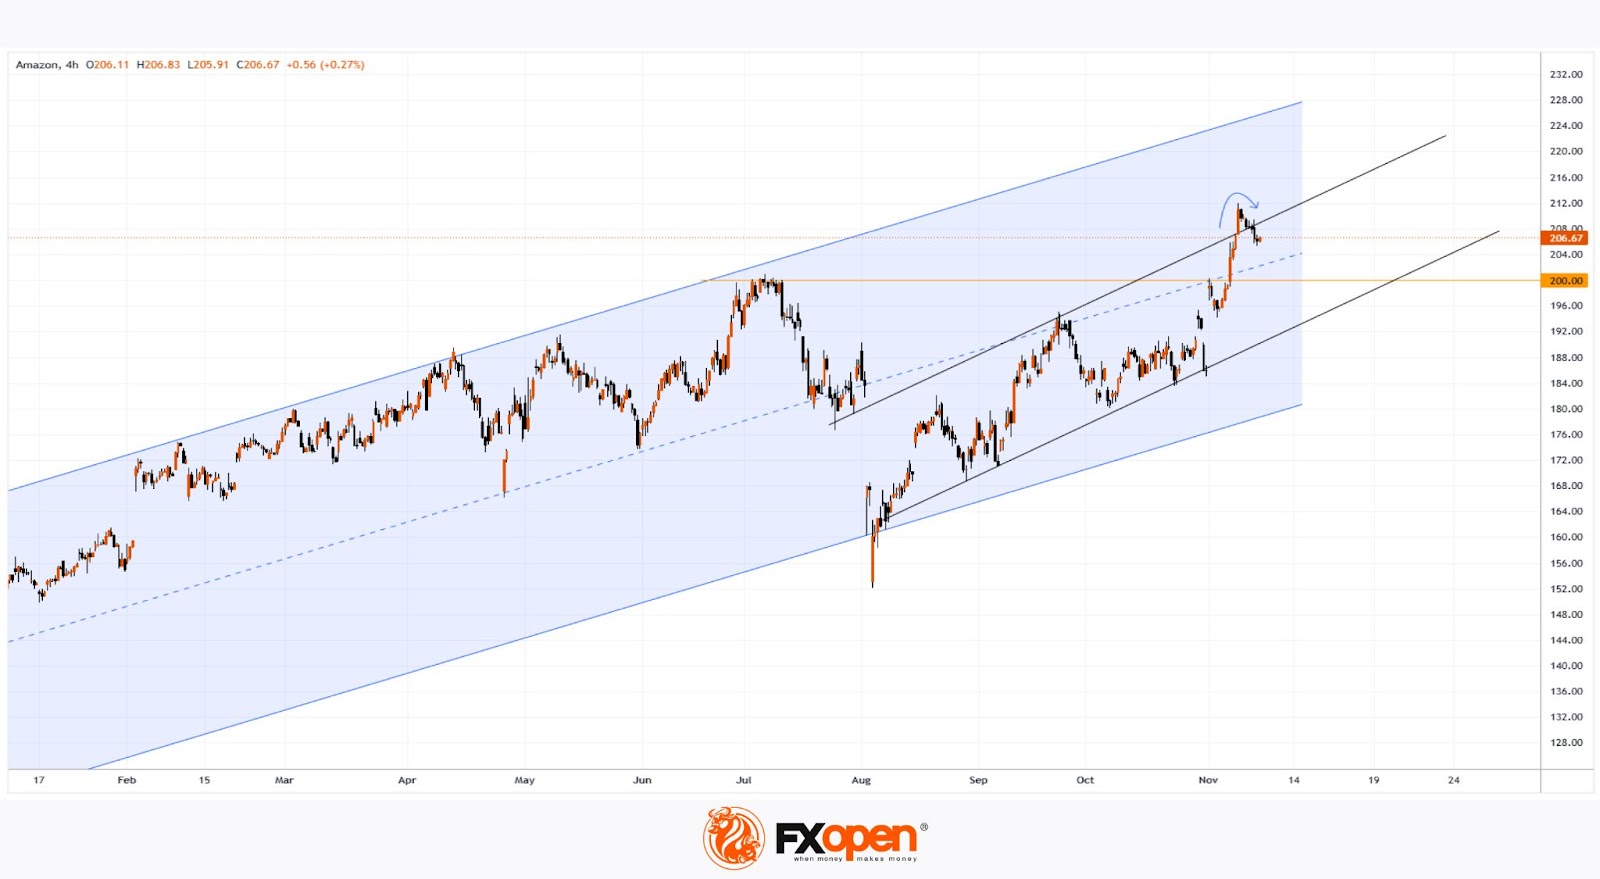
Today, Amazon’s stock chart shows the price beginning to round off (indicated by an arrow). Does this signal the end of the bullish trend?
Unlikely, given the strong fundamental support. In technical terms, it may be more accurate to consider the price’s vulnerability to a correction, especially as it sits near the upper boundary of an ascending channel.
Should a correction occur, a retest of the $200 level is possible. Support may come from the median line of the long-term blue channel or the lower boundary of the short-term black channel.
According to TipRanks, which surveyed 45 Wall Street analysts:
→ 44 analysts recommend buying AMZN stock;
→ On average, they forecast a 12-month price target of $238.
Buy and sell stocks of the world's biggest publicly-listed companies with CFDs on FXOpen’s trading platform. Open your FXOpen account now or learn more about trading share CFDs with FXOpen.
This article represents the opinion of the Companies operating under the FXOpen brand only. It is not to be construed as an offer, solicitation, or recommendation with respect to products and services provided by the Companies operating under the FXOpen brand, nor is it to be considered financial advice.
Stay ahead of the market!
Subscribe now to our mailing list and receive the latest market news and insights delivered directly to your inbox.


Latest articles

Weekly Market Insights with Gary Thomson: US Inflation, UK GDP, Chair Warsh Testimony, and Earnings
In this video, we’ll explore the key economic events and market trends, shaping the financial landscape. Get ready for insights into financial markets to help you navigate the week ahead. Let’s dive in!
In this episode of Market

GBP/AUD Analysis: The Tug-of-War Begins
Oil is back in the driver's seat, and both the pound and the aussie are feeling its grip. The Bank of England held rates at 3.75% in June, but with UK inflation at 2.8% and crude oil climbing

Australian Dollar Holds Above the Current Market Profile
The minutes from the Reserve Bank of Australia's (RBA) June meeting, released on 30 June, suggested that policymakers are not yet ready to rule out further policy tightening. Board members noted persistent excess demand and broad-based inflationary pressures across the