


FXOpen

As the AUD/USD chart shows, the Australian dollar posted strong performance in January and February. Since the start of the year, the “Aussie” has gained nearly 6% against the US dollar.
Among the bullish drivers:
→ The policy stance of the Reserve Bank of Australia (RBA), which raised its cash rate to 3.85% in February 2026, while many other central banks are considering rate cuts.
→ A resilient labour market. Australia’s unemployment rate remains at 4.1%, giving the RBA room to keep interest rates elevated.
→ Commodity markets. High prices for gold, iron ore and energy exports continue to support Australia’s trade balance.
However, an important CPI report is due tomorrow. Inflation data could inject additional volatility into the market and test the strength of the Australian dollar.
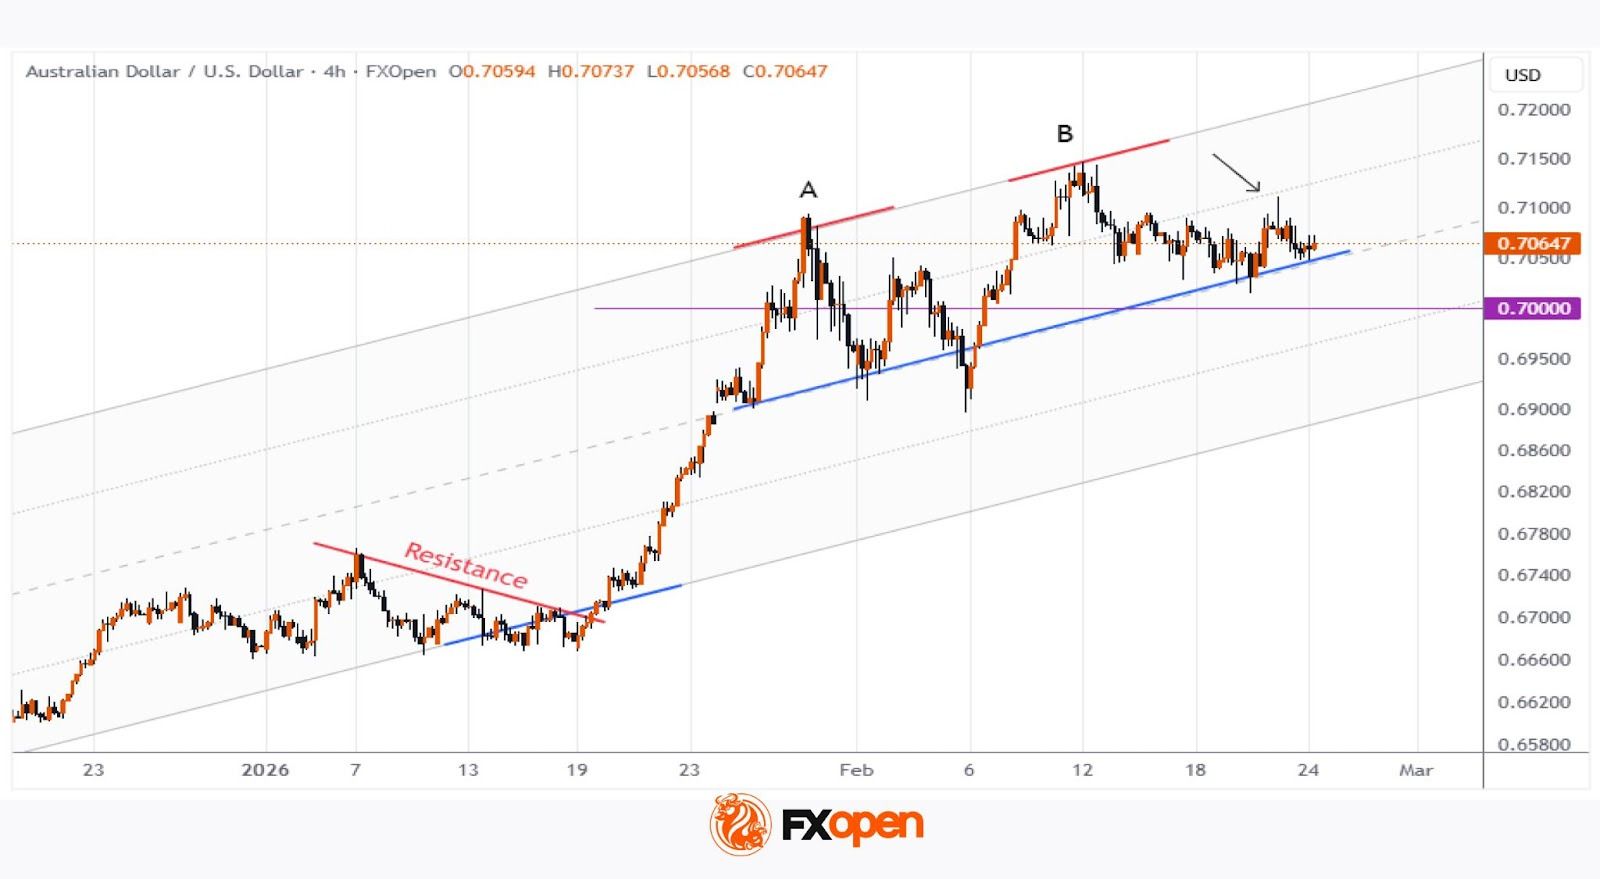
Technical Analysis of the AUD/USD Chart
In early January, we identified an ascending channel that remained valid through February 2026, as bulls managed to break above resistance line R. Note that:
→ The upper boundary of the channel acted as resistance (resulting in the formation of peaks A–B).
→ The median line served as support.
An important observation is that after forming peak B, the market quickly fell back below the level of peak A. This suggests insufficient buying pressure to sustain the advance.
At the same time, the recent candlestick with a long upper wick — a potential bull trap and a bearish signal — may indicate that the AUD/USD reaction to the CPI report could be negative.
In that case, a break below the channel’s median line cannot be ruled out, opening the way for a test of the psychological 0.7000 level.
Trade over 50 forex markets 24 hours a day with FXOpen. Take advantage of low commissions, deep liquidity, and spreads from 0.0 pips (additional fees may apply). Open your FXOpen account now or learn more about trading forex with FXOpen.
This article represents the opinion of the Companies operating under the FXOpen brand only. It is not to be construed as an offer, solicitation, or recommendation with respect to products and services provided by the Companies operating under the FXOpen brand, nor is it to be considered financial advice.
Stay ahead of the market!
Subscribe now to our mailing list and receive the latest market news and insights delivered directly to your inbox.


Latest articles

NVDA Shares Approach Key Resistance
Nvidia’s chip production is concentrated with Taiwanese contractor TSMC, increasing the company’s exposure to geopolitical risks and US export policy. Restrictions on shipments to China, including decisions related to H20-series chips, have led to significant financial adjustments, which

EUR/USD and GBP/USD at Range Boundaries Ahead of Geopolitical Decisions
European currencies are entering a consolidation phase following an attempted recovery, while market participants adopt a wait-and-see approach amid uncertainty surrounding the geopolitical landscape. Current price action reflects a balance between a softer US dollar and a lack of sustained

Market Analysis: Gold Price Slips Back, WTI Crude Oil Rally Gains Fresh Strength
Gold price rallied above $4,750 before correcting lower. Crude oil prices are rising and could climb further higher toward $110.00.
Important Takeaways for Gold and WTI Crude Oil Prices Analysis Today
· Gold price gained pace for a move