


FXOpen

As shown on the XAU/USD chart today, the price of gold is:
→ above the psychological level of $2,500 per ounce;
→ near a key resistance marked by a red line labelled Support 2. This line has been preventing further price growth several times since 20 August, when the all-time high was reached.
If the bulls manage to break through this line, it could turn into a support level, as happened with Support 1 (as indicated by arrows). This would set the stage for a potential rally within the upward channel, marked in blue. From a technical analysis perspective, a break above the “bull flag” pattern could signal a resumption of the uptrend.
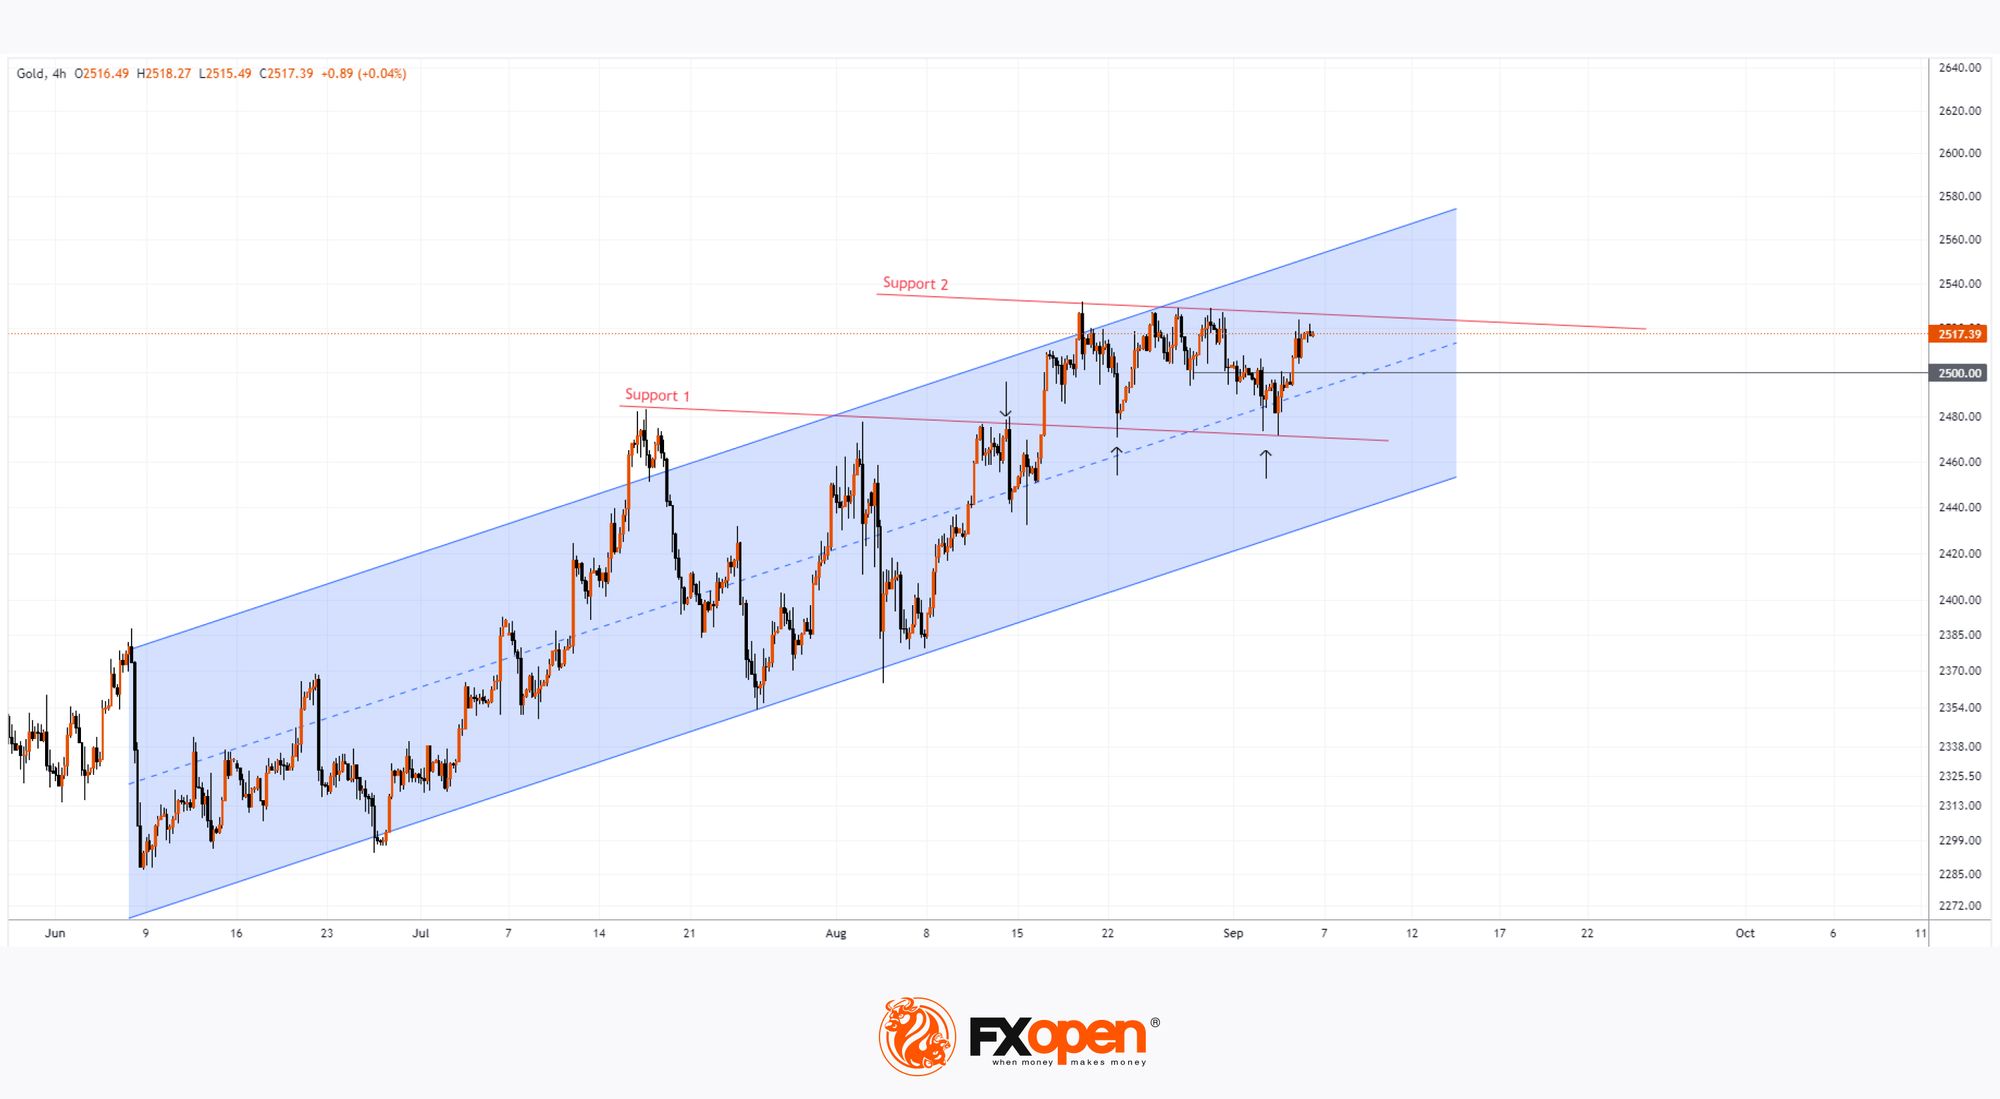
On the other hand, we can't rule out the possibility of a price reversal at Support 2. In this case, the chart could start to form a bearish “triple top” pattern from a technical standpoint.
Which scenario – bullish or bearish – will play out? Much depends on the fundamentals. Today at 15:30 GMT+3, US labour market data will be released, which is likely to have a strong impact on financial markets due to the upcoming Federal Reserve meeting, where a rate cut is expected.
Disappointing data on unemployment and job creation could indicate issues in the US economy and lead to a rise in gold prices, as gold is seen as a safe-haven asset during times of geopolitical tension and economic uncertainty.
Start trading commodity CFDs with tight spreads (additional fees may apply). Open your trading account now or learn more about trading commodity CFDs with FXOpen.
This article represents the opinion of the Companies operating under the FXOpen brand only. It is not to be construed as an offer, solicitation, or recommendation with respect to products and services provided by the Companies operating under the FXOpen brand, nor is it to be considered financial advice.
Stay ahead of the market!
Subscribe now to our mailing list and receive the latest market news and insights delivered directly to your inbox.


Latest articles

European Currencies Decline: Pound Hits New Lows, Euro Under Pressure
European currencies continue to weaken against the US dollar amid rising geopolitical tensions and increased demand for safe-haven and liquid assets. Market participants are reducing exposure to riskier instruments, putting pressure on both the euro and the pound. Additional support

Market Analysis: GBP/USD Dips Further As EUR/GBP Regains Traction
GBP/USD failed to climb above 1.3500 and corrected some gains. EUR/GBP started a decent increase and might aim for more gains above 0.8700.
Important Takeaways for GBP/USD and EUR/GBP Analysis Today
· The British Pound
