


AUD/USD Rate Rises after RBA Decision
FXOpen
This morning the Central Bank of Australia decided to keep the interest rate at the same level = 4.35%, as expected.
However, RBA management said that further rate hikes cannot be ruled out as inflation is still too high. This is a clear signal that policy easing is unlikely in the near future.
AUD/USD has rallied from its 2024 low following this relatively hawkish rhetoric.
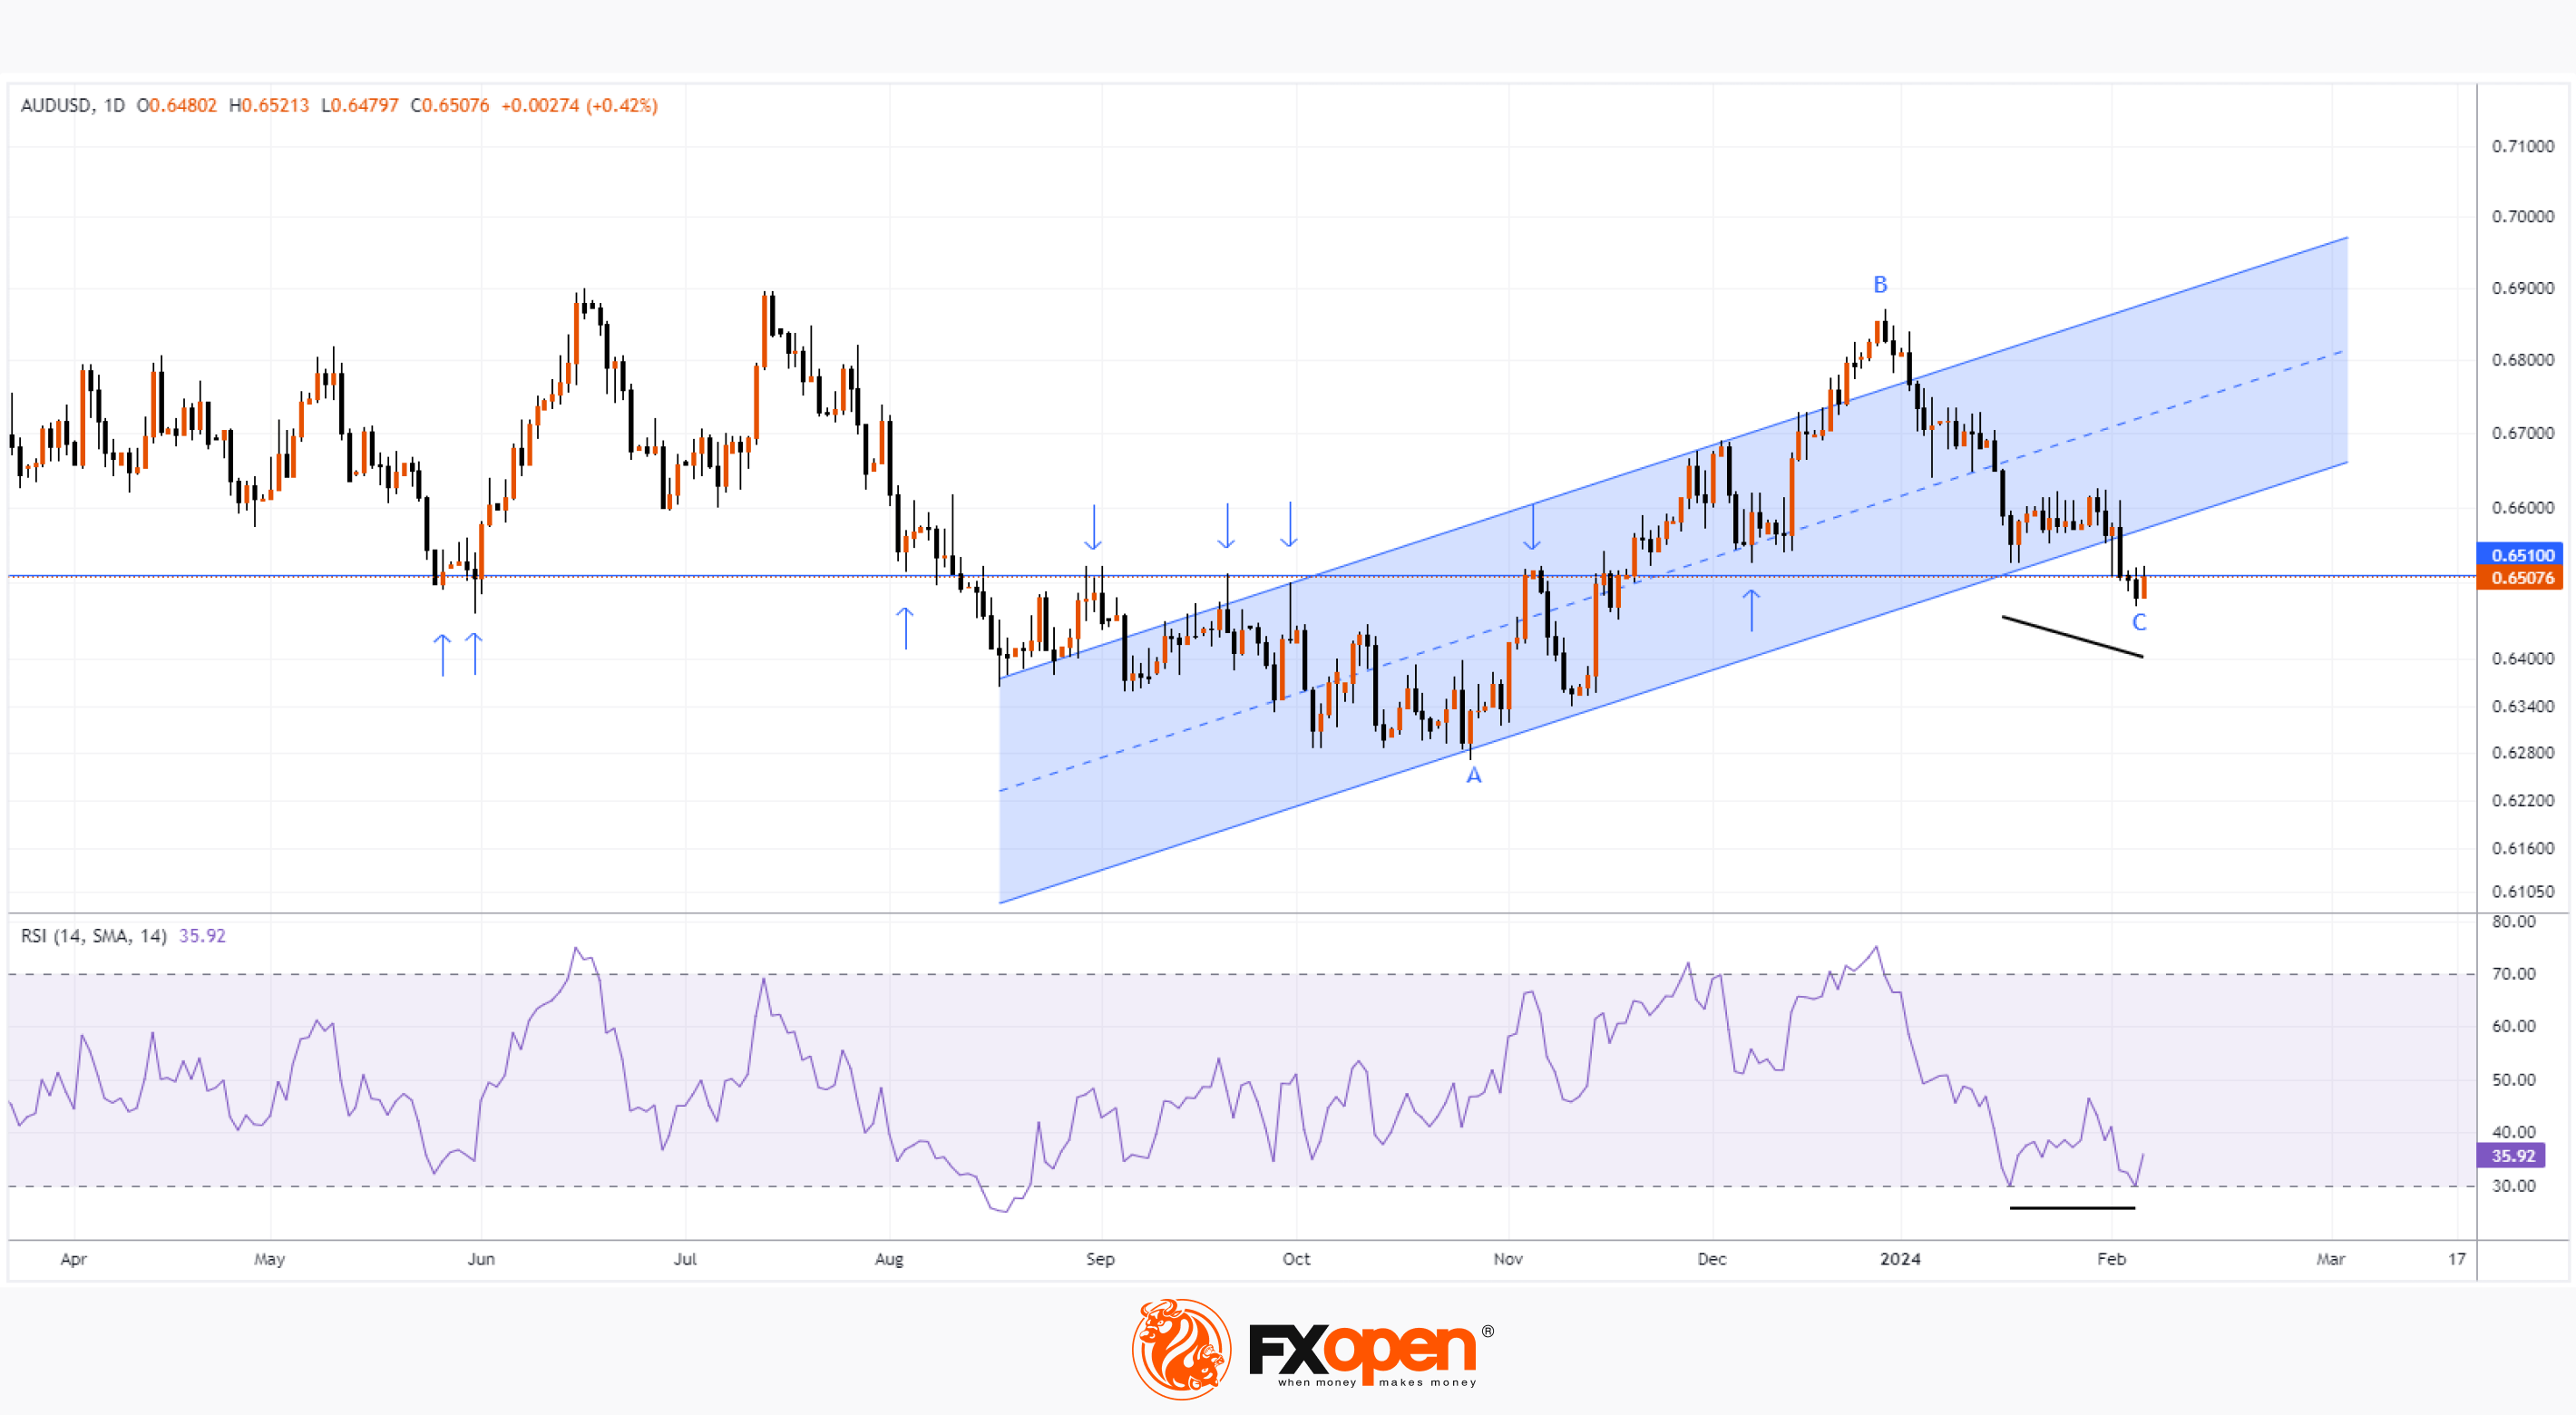
The daily AUD/USD chart today shows that if the bullish momentum does not fade, then based on the results of today's trading the following may form:
→ bullish engulfing candlestick pattern;
→ bullish divergence.
At the same time, the price is near the important level of 0.6510, which since mid-2023 has repeatedly shown its influence on the AUD/USD price both as support and resistance (shown by arrows).
The ability of the AUD/USD price to consolidate above this key level will indicate the strength of demand, with:
→ a false bearish breakdown of the level of 0.651 may form on the chart;
→ it is possible that the bulls will try to build on their success and return the AUD/USD price to the area of the ascending channel (shown in blue), which dates back to last fall.
From the point of view of technical analysis of AUD/USD, the likelihood of a bullish scenario is increased by the fact that point C (the current low of the year) is located in the area of the 0.382 Fibonacci level of the impulse movement A→B.
Trade over 50 forex markets 24 hours a day with FXOpen. Take advantage of low commissions, deep liquidity, and spreads from 0.0 pips (additional fees may apply). Open your FXOpen account now or learn more about trading forex with FXOpen.
This article represents the opinion of the Companies operating under the FXOpen brand only. It is not to be construed as an offer, solicitation, or recommendation with respect to products and services provided by the Companies operating under the FXOpen brand, nor is it to be considered financial advice.
Stay ahead of the market!
Subscribe now to our mailing list and receive the latest market news and insights delivered directly to your inbox.


Latest articles

Gold: Attempt to Break Out of the Short-Term Trend
Fundamental backdrop
In April, US inflation stood at 3.8% year-on-year — the highest level since May 2023. A significant contribution came from rising fuel prices amid escalating tensions in the Middle East. Market reaction was somewhat paradoxical: instead of inflows

USD/JPY and USD/CAD Test Key Levels Ahead of the ADP Employment Report
The US dollar is holding on to its recently gained ground following a series of strong macroeconomic releases and a rise in US Treasury yields. Additional support for the greenback comes from resilient inflation readings, expectations that the Federal Reserve

EUR/GBP: June ECB Meeting Could Bring the Period of Equilibrium to an End
Fundamental backdrop
The divergence in the monetary policy paths of the ECB and the Bank of England is creating a mixed outlook for the pair. Having completed a cycle of eight consecutive rate cuts in 2025, the ECB left its