


FXOpen

As the AUD/USD chart indicates, the pair updated its yearly highs today, reaching levels above 0.6710. Since the beginning of December, it has risen by approximately 2.45%.
Key bullish drivers include:
→ Central bank policy divergence. While the Federal Reserve is cutting interest rates, the Reserve Bank of Australia is seriously discussing the possibility of rate hikes in 2026 (as reflected in the minutes of the latest RBA meeting).
→ Record-high gold prices. As the Australian dollar is a commodity currency, it shows a strong correlation with prices of key export commodities.
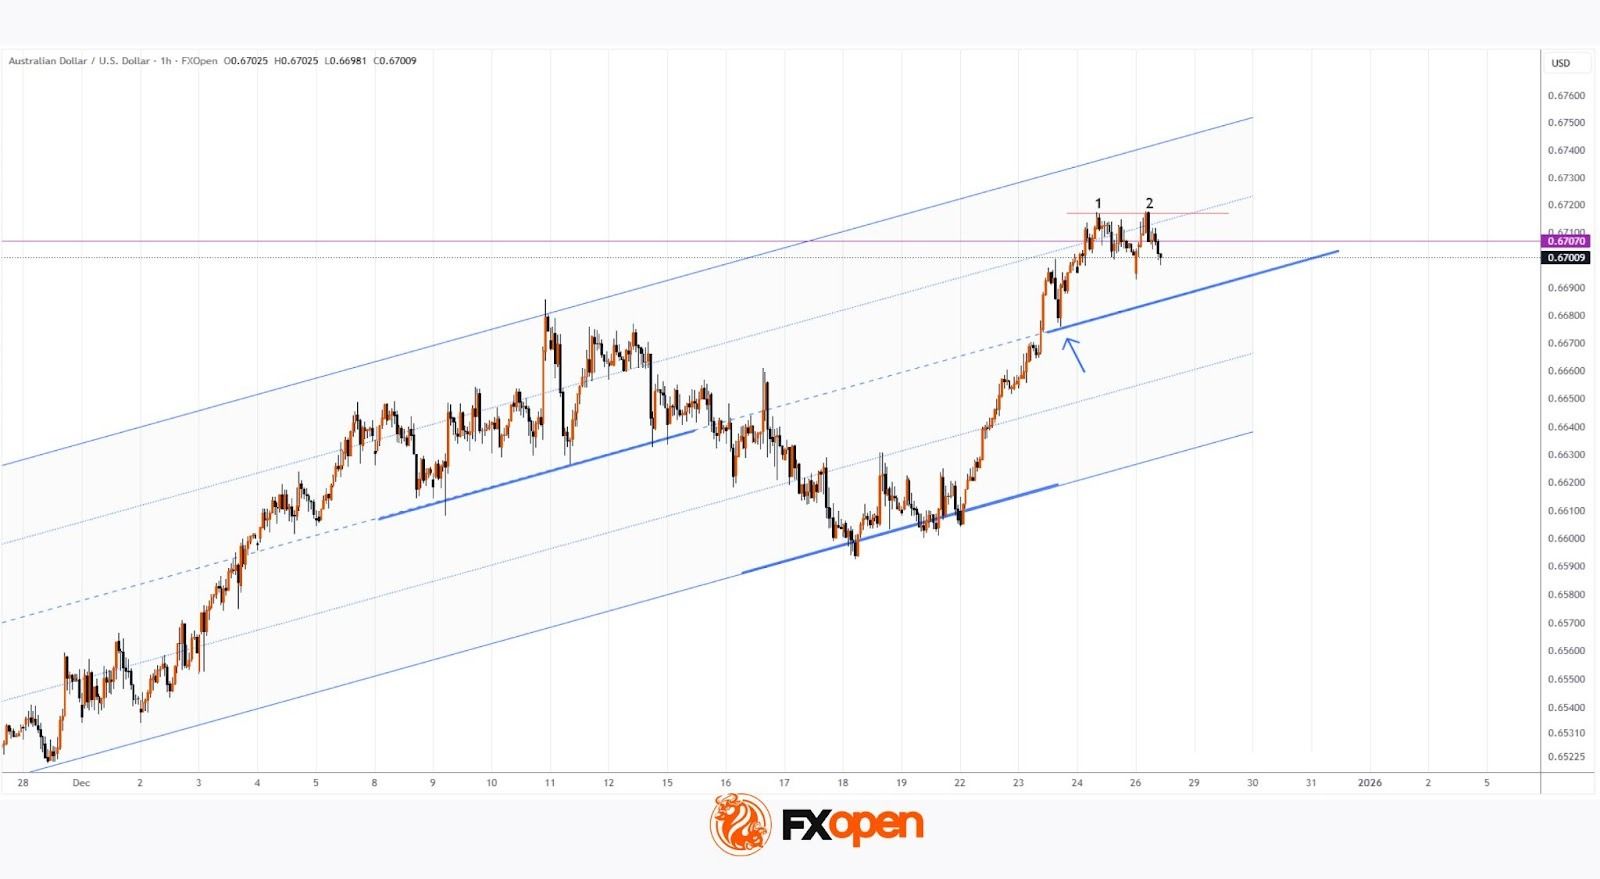
Technical analysis of the AUD/USD chart
In December, price action continued to form an ascending channel. In this context:
→ the price found support near the lower boundary between 18 and 22 December;
→ the median line regained its role as support (as indicated by the arrow).
However, bulls have a serious reason for concern.
After breaking above the September high near the 0.6707 level, a Double Top pattern appears to be forming. From a Smart Money Concept perspective, this setup may be interpreted as a bearish liquidity sweep.
Given the above, we can assume that the median line may still act as support. Nevertheless, if bears manage to seize control, the AUD/USD exchange rate could decline towards the lower boundary of the channel and attempt a downside breakout.
Trade over 50 forex markets 24 hours a day with FXOpen. Take advantage of low commissions, deep liquidity, and spreads from 0.0 pips (additional fees may apply). Open your FXOpen account now or learn more about trading forex with FXOpen.
This article represents the opinion of the Companies operating under the FXOpen brand only. It is not to be construed as an offer, solicitation, or recommendation with respect to products and services provided by the Companies operating under the FXOpen brand, nor is it to be considered financial advice.
Stay ahead of the market!
Subscribe now to our mailing list and receive the latest market news and insights delivered directly to your inbox.


Latest articles

NVDA Shares Approach Key Resistance
Nvidia’s chip production is concentrated with Taiwanese contractor TSMC, increasing the company’s exposure to geopolitical risks and US export policy. Restrictions on shipments to China, including decisions related to H20-series chips, have led to significant financial adjustments, which

EUR/USD and GBP/USD at Range Boundaries Ahead of Geopolitical Decisions
European currencies are entering a consolidation phase following an attempted recovery, while market participants adopt a wait-and-see approach amid uncertainty surrounding the geopolitical landscape. Current price action reflects a balance between a softer US dollar and a lack of sustained

Market Analysis: Gold Price Slips Back, WTI Crude Oil Rally Gains Fresh Strength
Gold price rallied above $4,750 before correcting lower. Crude oil prices are rising and could climb further higher toward $110.00.
Important Takeaways for Gold and WTI Crude Oil Prices Analysis Today
· Gold price gained pace for a move