


FXOpen
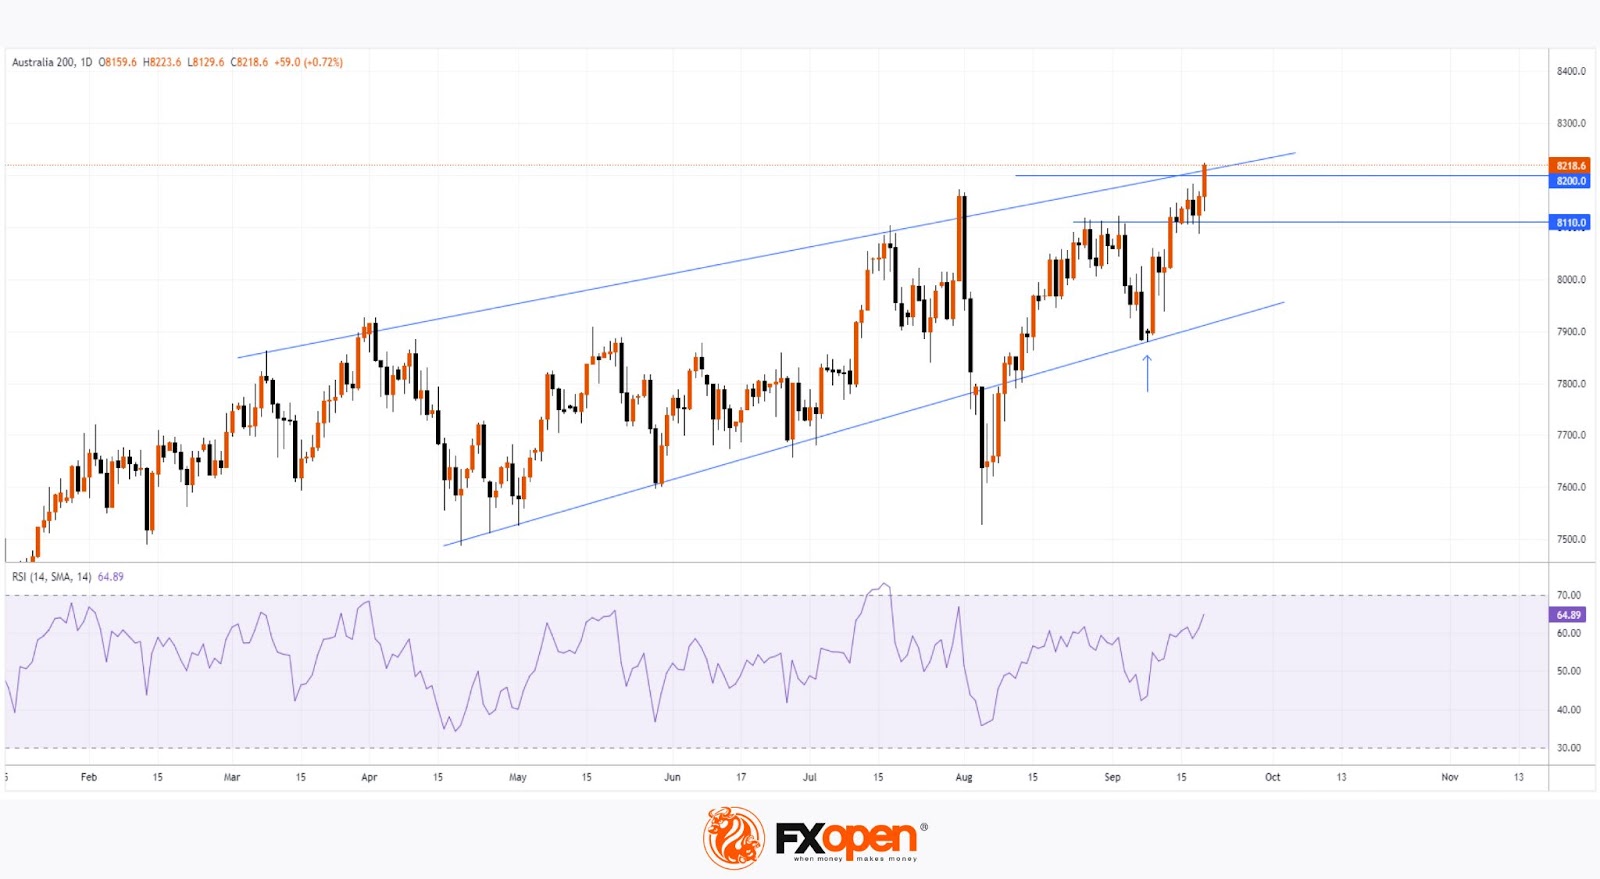
As seen on the S&P/ASX 200 chart (Australia 200 on FXOpen), today's candle surpassed the 8200 level, marking a new all-time high.
Positive sentiment was driven by:
→ The Federal Reserve’s decision to cut interest rates, which led to a surge in volatility and set historical records for gold prices (XAU/USD), the S&P 500 index (US SPX 500 mini on FXOpen), and others.
→ Today's positive news from the Australian labour market, showing that unemployment has not increased, and the number of new jobs created in the month exceeded expectations (actual = 47.5 thousand, forecast = 26.4 thousand).
Technical Analysis
The S&P/ASX 200 chart (Australia 200 on FXOpen) indicates price movement within converging trend lines:
→ The lower line was breached in early August amid widespread panic across financial markets. However, it later resumed its role as support, as indicated by the arrow.
→ The upper line acts as resistance, which today is reinforced by the psychological level of 8200. Despite this, the price's position near the candle's high suggests that bulls are showing persistence, at least for now.
Given that the RSI indicator is at its highest level since early August, it is reasonable to anticipate that current bullish sentiment might face increased selling pressure in the short term. If the S&P/ASX 200 (Australia 200 on FXOpen) follows a correction scenario, support could come from the previously mentioned level of 8200, as well as the 8110 level, which has shifted from resistance to support.
Trade global index CFDs with zero commission and tight spreads (additional fees may apply). Open your FXOpen account now or learn more about trading index CFDs with FXOpen.
This article represents the opinion of the Companies operating under the FXOpen brand only. It is not to be construed as an offer, solicitation, or recommendation with respect to products and services provided by the Companies operating under the FXOpen brand, nor is it to be considered financial advice.
Stay ahead of the market!
Subscribe now to our mailing list and receive the latest market news and insights delivered directly to your inbox.


Latest articles

Market Analysis: GBP/USD Dips Further As EUR/GBP Regains Traction
GBP/USD failed to climb above 1.3500 and corrected some gains. EUR/GBP started a decent increase and might aim for more gains above 0.8700.
Important Takeaways for GBP/USD and EUR/GBP Analysis Today
· The British Pound


Market Insights with Gary Thomson: Oil, US Retail Sales & NFP in Focus
In this video, we’ll explore the key economic events and market trends, shaping the financial landscape. Get ready for insights into financial markets to help you navigate the week ahead. Let’s dive in!
In this episode of Market