


Australian S&P/ASX 200 Index Hits All-Time High
FXOpen
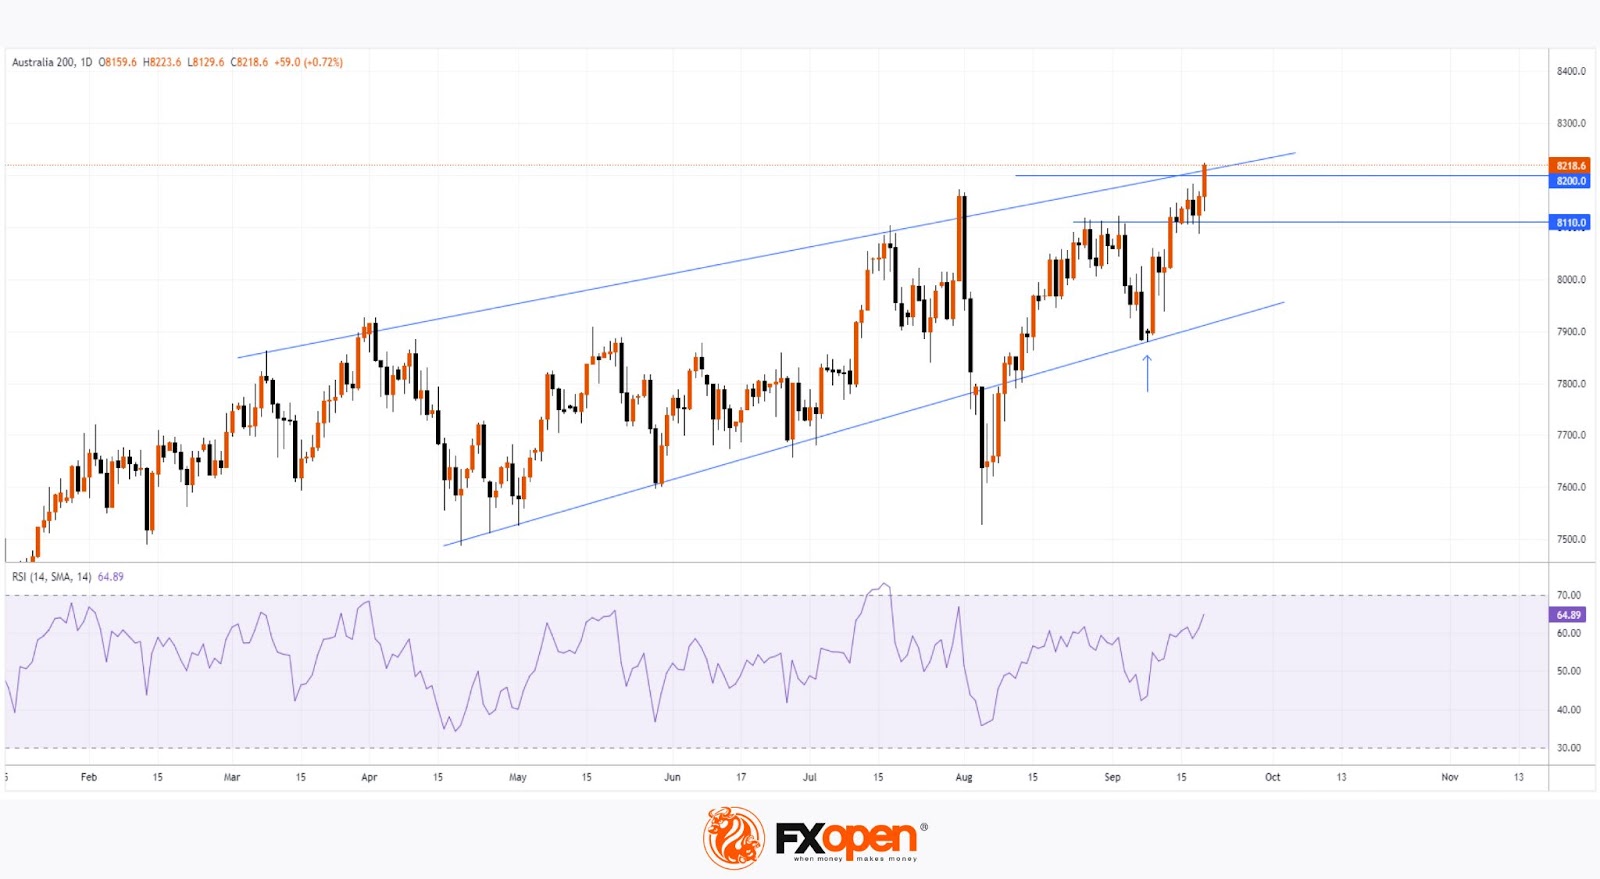
As seen on the S&P/ASX 200 chart (Australia 200 on FXOpen), today's candle surpassed the 8200 level, marking a new all-time high.
Positive sentiment was driven by:
→ The Federal Reserve’s decision to cut interest rates, which led to a surge in volatility and set historical records for gold prices (XAU/USD), the S&P 500 index (US SPX 500 mini on FXOpen), and others.
→ Today's positive news from the Australian labour market, showing that unemployment has not increased, and the number of new jobs created in the month exceeded expectations (actual = 47.5 thousand, forecast = 26.4 thousand).
Technical Analysis
The S&P/ASX 200 chart (Australia 200 on FXOpen) indicates price movement within converging trend lines:
→ The lower line was breached in early August amid widespread panic across financial markets. However, it later resumed its role as support, as indicated by the arrow.
→ The upper line acts as resistance, which today is reinforced by the psychological level of 8200. Despite this, the price's position near the candle's high suggests that bulls are showing persistence, at least for now.
Given that the RSI indicator is at its highest level since early August, it is reasonable to anticipate that current bullish sentiment might face increased selling pressure in the short term. If the S&P/ASX 200 (Australia 200 on FXOpen) follows a correction scenario, support could come from the previously mentioned level of 8200, as well as the 8110 level, which has shifted from resistance to support.
Trade global index CFDs with zero commission and tight spreads (additional fees may apply). Open your FXOpen account now or learn more about trading index CFDs with FXOpen.
This article represents the opinion of the Companies operating under the FXOpen brand only. It is not to be construed as an offer, solicitation, or recommendation with respect to products and services provided by the Companies operating under the FXOpen brand, nor is it to be considered financial advice.
Stay ahead of the market!
Subscribe now to our mailing list and receive the latest market news and insights delivered directly to your inbox.


Latest articles

AUD/CAD: Months of Indecision — Is a Breakout Finally Coming?
The Australian dollar has clawed back most of its end-of-June losses, when it touched three-month lows against the greenback amid escalating Middle East tensions. Since then, sentiment has improved: the RBA's Assistant Governor Sarah Hunter signalled the board stands ready

USD/JPY: Battling at the Top of the Triangle
On 3 July, Japan's Finance Minister, Satsuki Katayama, stated that the Ministry of Finance remains in close contact with US authorities regarding developments in USD/JPY as the yen traded near its weakest level in almost 40 years. Similar verbal

Dow Jones (DJIA): Consolidation Beyond the Trend
Federal Reserve Chair Kevin Warsh testified before Congress on 14–15 July, reaffirming the Fed's commitment to bringing inflation back to target while providing no clear guidance on the future path of interest rates. Meanwhile, June inflation data came in