


Australian Stock Index ASX 200 Reaches Record High
FXOpen
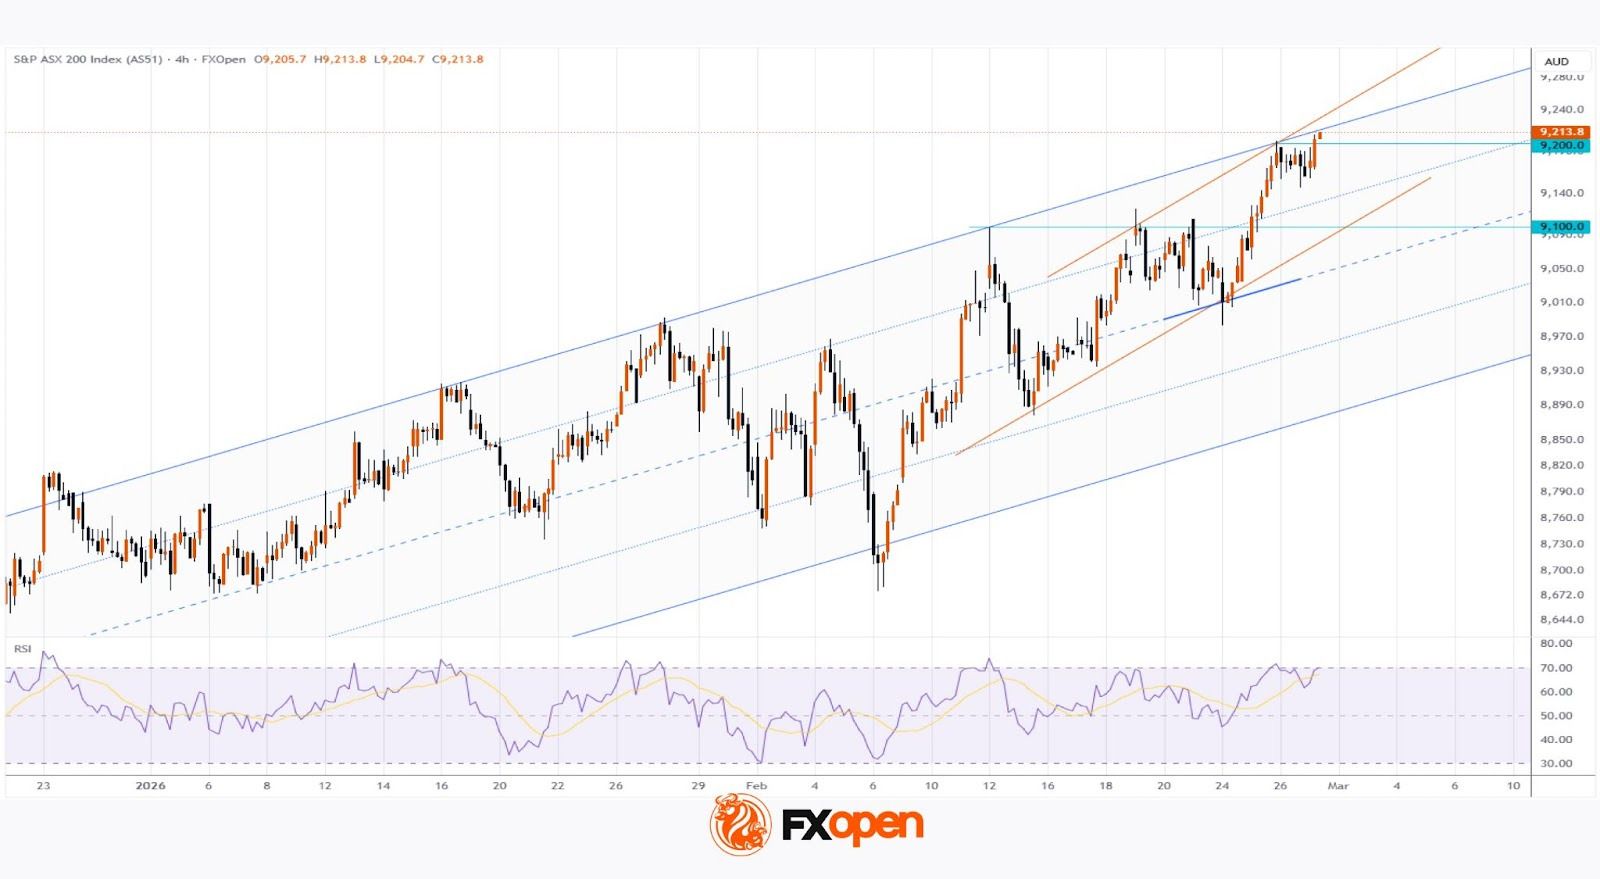
As the chart of the ASX 200 index (Australia 200 on FXOpen) shows, today’s candle has moved above the 9,210 level, marking a fresh all-time high. Since the start of the year, the benchmark of Australian equities has gained more than 5.6%, supported by:
→ A strong earnings season. A significant number of companies not only exceeded analysts’ expectations but also upgraded their profit forecasts for the 2026 financial year.
→ Economic resilience. The unemployment rate remains low despite the Reserve Bank of Australia maintaining a firm policy stance.
→ Elevated prices for gold, uranium and copper, along with signs of a recovery in China’s economy, which have provided support to the mining sector.
Technical Analysis of the ASX 200 Chart (Australia 200 on FXOpen)
Price action continues to unfold within an ascending channel (highlighted in blue) that has been in place since autumn 2025. Within this structure:
→ The median line acted as support on 24 February, signalling underlying strength.
→ The upper boundary has repeatedly served as resistance during 2026.
It is worth noting that:
→ The psychological 9,100 level had previously capped gains within the channel.
→ The index has now climbed above 9,200 near the upper boundary of the blue channel.
→ The RSI indicator is approaching overbought territory.
Given these factors, it is reasonable to assume that some long-position holders may look to take profits, potentially leading to a pause in bullish momentum. As a result, the following scenario cannot be ruled out:
→ Failure to secure a sustained move above 9,200;
→ The development of a corrective pullback in the ASX 200 (Australia 200 on FXOpen).
In such a case, support may emerge near the lower orange trend line, which reflects the upward trajectory seen during the second half of the month.
Trade global index CFDs with zero commission and tight spreads (additional fees may apply). Open your FXOpen account now or learn more about trading index CFDs with FXOpen.
This article represents the opinion of the Companies operating under the FXOpen brand only. It is not to be construed as an offer, solicitation, or recommendation with respect to products and services provided by the Companies operating under the FXOpen brand, nor is it to be considered financial advice.
Stay ahead of the market!
Subscribe now to our mailing list and receive the latest market news and insights delivered directly to your inbox.


Latest articles


Market Repricing of Risk as Gold Loses Safe-Haven Demand
Geopolitical tensions in the Middle East had remained the primary macro driver for the gold market over recent weeks; however, on 8 April the situation shifted sharply as the United States and Iran agreed to a temporary two-week ceasefire, including

Commodity Currencies on the Rise: Market Focus Shifts to US and Canadian Data
Commodity-linked currencies continue to strengthen, while the US dollar remains under pressure amid easing geopolitical tensions and a shift in investor preference towards riskier assets. Reports of a temporary ceasefire between the US and Iran have helped stabilise sentiment and