


FXOpen

Analysing the oil market on the XBR/USD chart on 20 August, when Brent was trading around $77 per barrel, we:
→ Identified resistance around $81.60;
→ Noted that the price was approaching a key support level (shown by the yellow line), which has been in effect for several months;
→ Speculated that bears might attempt to break the August low.
This attempt by the bears can be seen in the price drop to $75.55 on 22 August.
However, the August low was not breached, as the yellow support line had an impact on the price—Brent crude oil reversed upwards (indicated by an arrow).
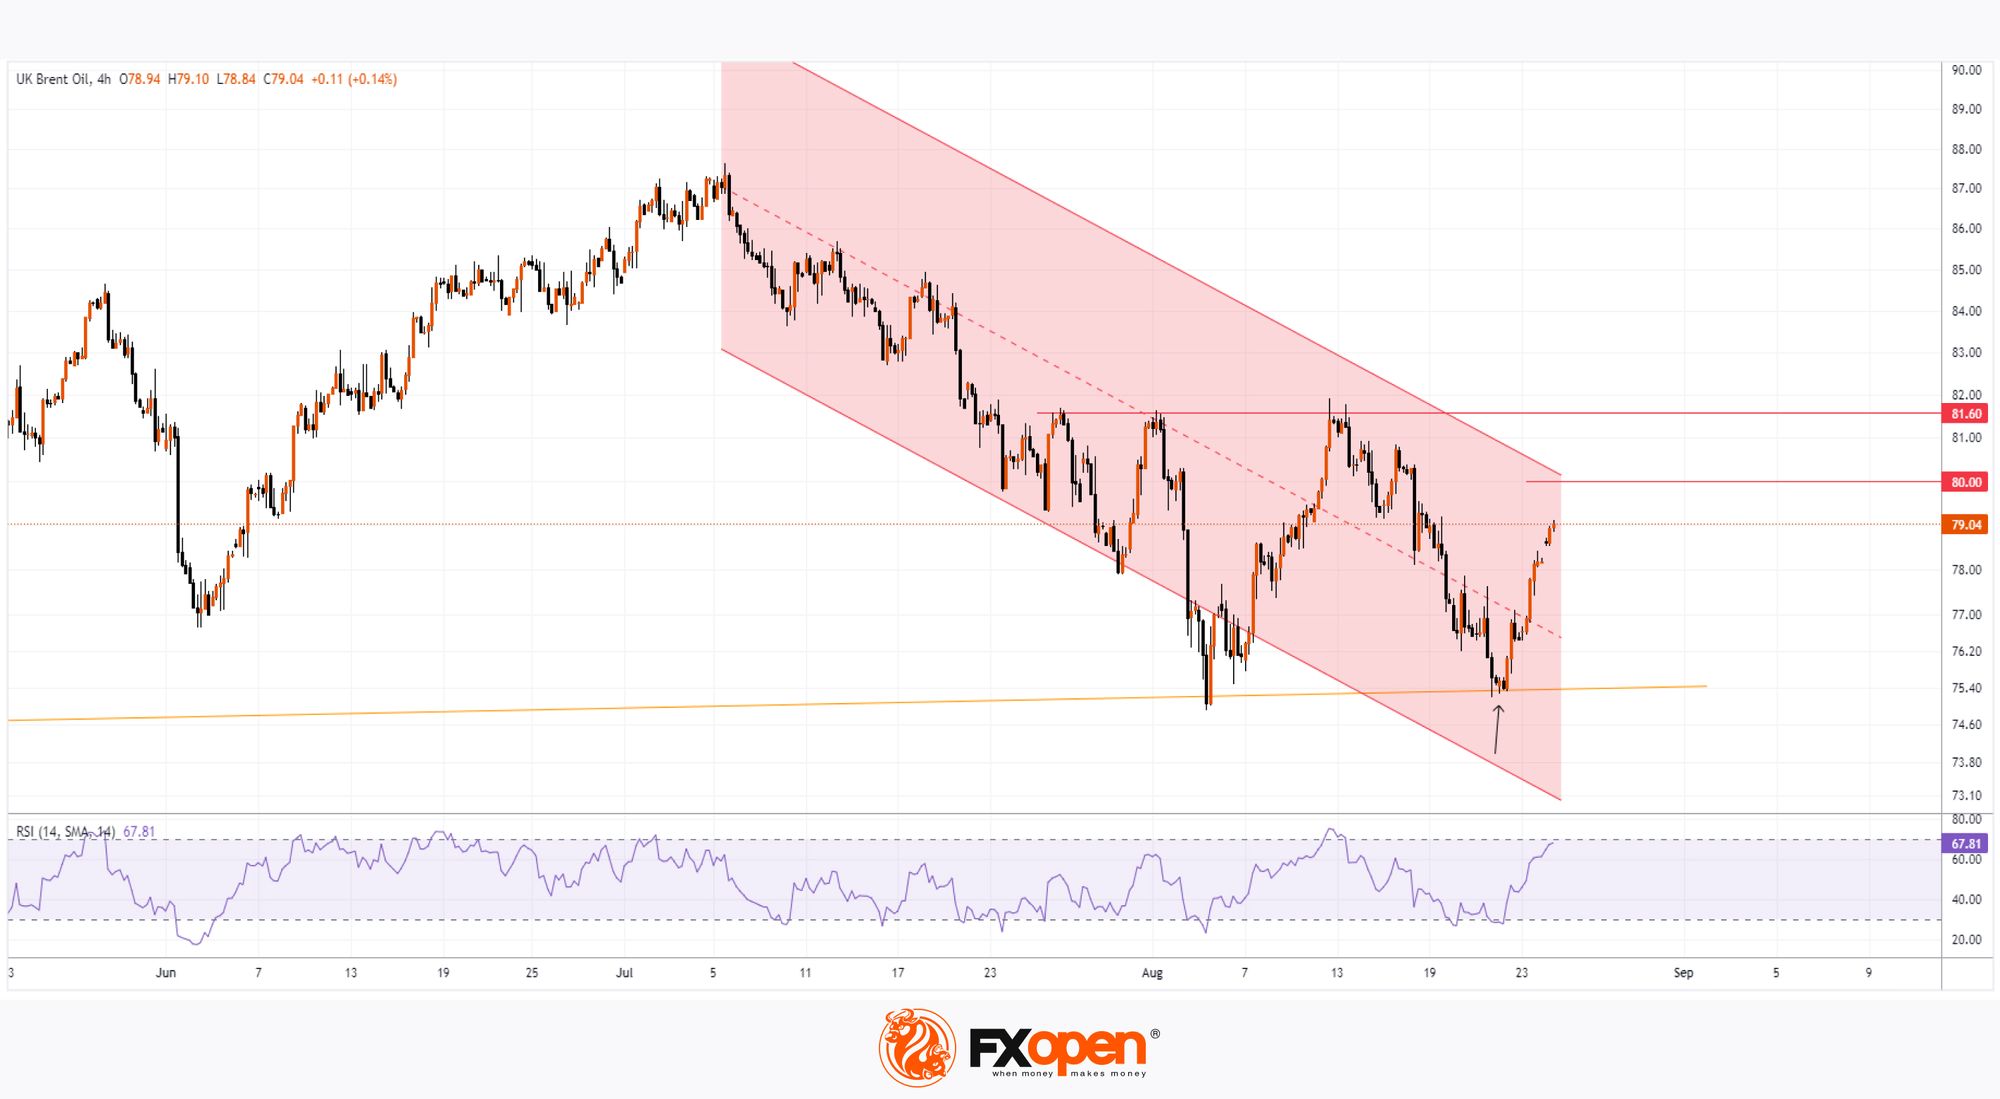
As shown on the XBR/USD chart, Monday's trading opened with a bullish gap, and the price is near $79 per barrel.
The price increase was supported by news of a potential escalation of conflict in the Middle East. According to Reuters:
→ On Sunday evening, Israel issued new evacuation orders for the central part of the Gaza Strip, forcing more families to flee;
→ Israel and Hezbollah exchanged heavy rocket fire;
→ Hezbollah's leader mentioned the possibility of further strikes on Israel.
From a technical analysis perspective of the XBR/USD chart today:
→ The price is forming a downward channel (shown in red) and is approaching its upper boundary, which could provide resistance;
→ Resistance could also be expected at the psychological level of $80 per barrel.
This leaves some room, albeit limited, for further growth. However, bulls will need to demonstrate their persistence when they encounter a block of resistance around the $80 level. It is possible that the RSI may be in the overbought zone at that point.
Whether Brent crude oil can break through the upper boundary of the downward channel in the coming days will largely depend on the nature of the news from the Middle East.
Start trading commodity CFDs with tight spreads (additional fees may apply). Open your trading account now or learn more about trading commodity CFDs with FXOpen.
This article represents the opinion of the Companies operating under the FXOpen brand only. It is not to be construed as an offer, solicitation, or recommendation with respect to products and services provided by the Companies operating under the FXOpen brand, nor is it to be considered financial advice.
Stay ahead of the market!
Subscribe now to our mailing list and receive the latest market news and insights delivered directly to your inbox.


Latest articles

Market Analysis: GBP/USD Dips Further As EUR/GBP Regains Traction
GBP/USD failed to climb above 1.3500 and corrected some gains. EUR/GBP started a decent increase and might aim for more gains above 0.8700.
Important Takeaways for GBP/USD and EUR/GBP Analysis Today
· The British Pound


Market Insights with Gary Thomson: Oil, US Retail Sales & NFP in Focus
In this video, we’ll explore the key economic events and market trends, shaping the financial landscape. Get ready for insights into financial markets to help you navigate the week ahead. Let’s dive in!
In this episode of Market