


Brent Oil Price Drops Over 3.5% in Two Days
FXOpen

As indicated by the XBR/USD chart, the price per barrel opened at $80.28 on Friday and closed at $77.27 on Monday. Moreover, early Tuesday trading also shows a downward trend.
Bearish sentiment in the market is being influenced by geopolitical factors, particularly the easing of tensions in the Middle East. According to media reports, Israeli Prime Minister Benjamin Netanyahu has accepted a proposal aimed at resolving disagreements between Israel and Hamas.
Additionally, ANZ Bank analysts point to a reduction in petrol consumption in China due to the increasing use of electric vehicles.
Could Brent crude oil prices continue to fall further?
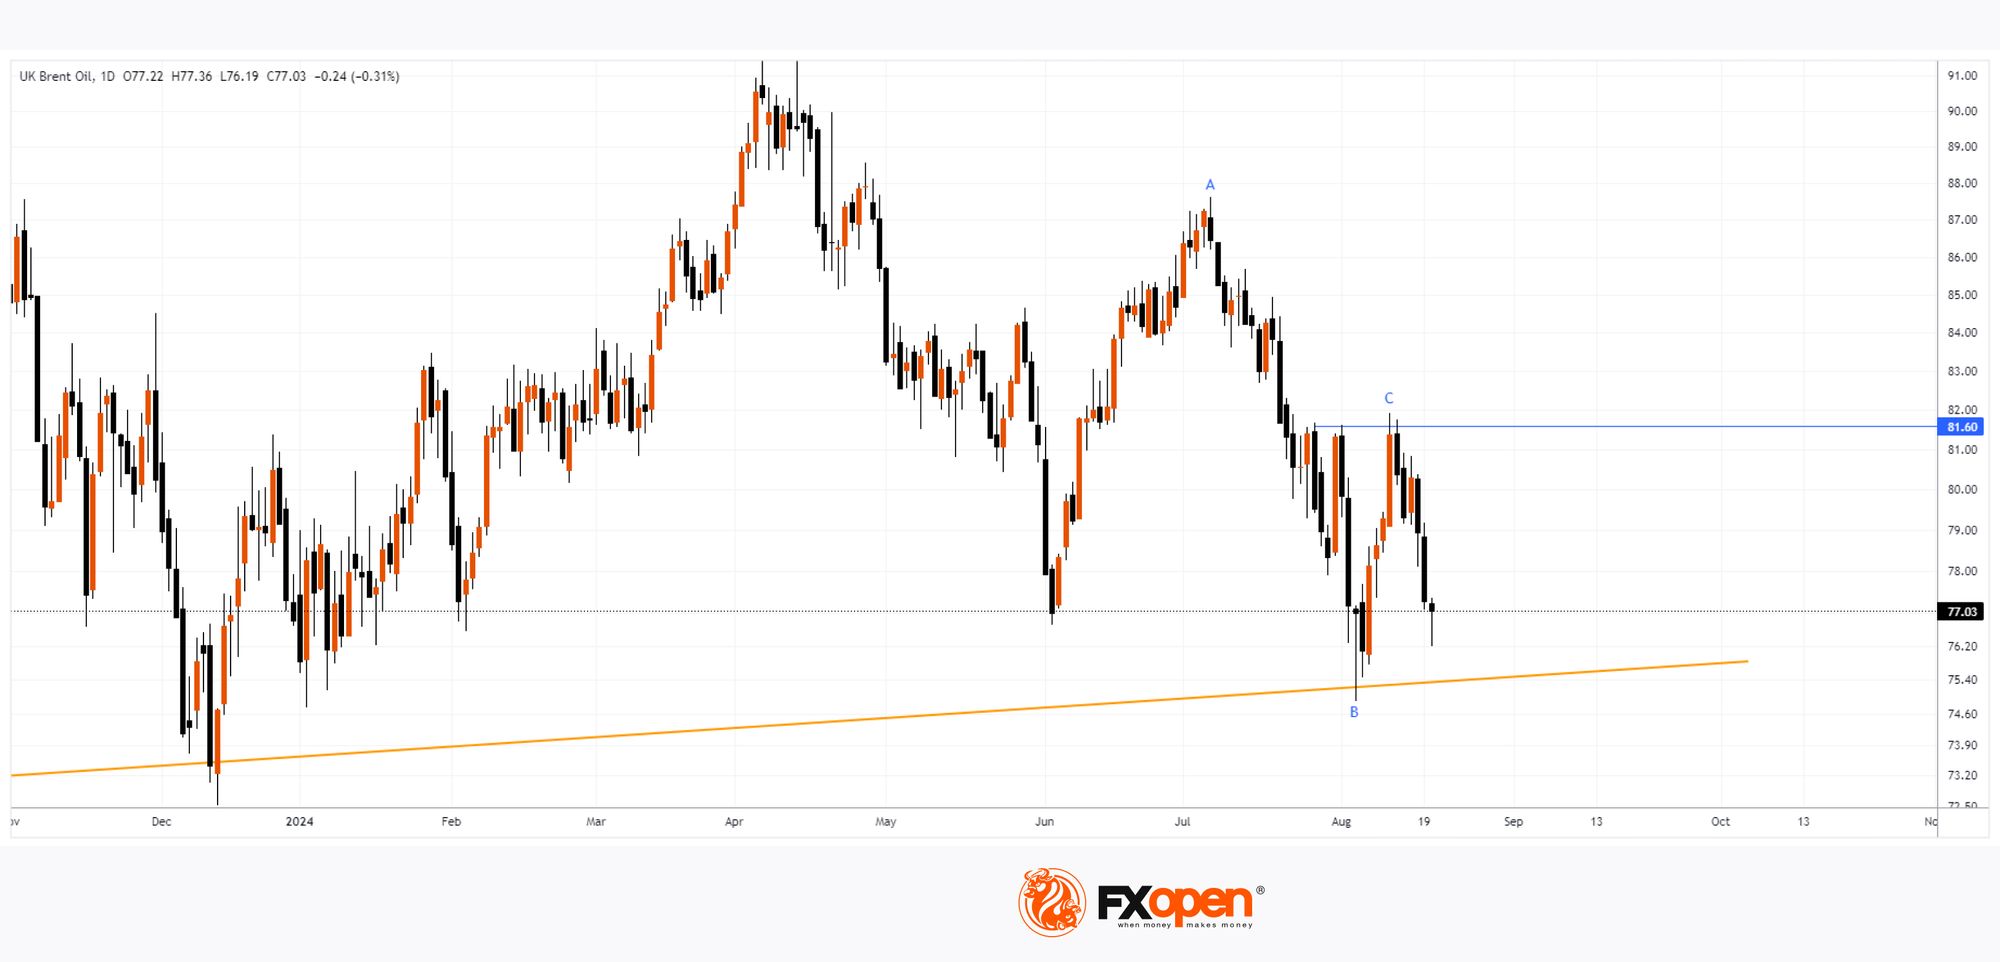
Technical analysis of the XBR/USD chart indicates that the price is approaching a key support level (shown in yellow) that dates back to 2023. This raises concerns, especially given the bearish indicators:
→ The recovery from B to C has retraced approximately 50% of the A to B downward impulse;
→ The formation of peak C has seen false bullish breakouts of previous local highs;
→ The bearish candles on Friday and Monday have broad bodies and closed near their lows, indicating a lack of demand (or effective selling pressure).
Thus, it is reasonable to assume that the bears might attempt to breach the critical support level, potentially leading to a new low for August.
Start trading commodity CFDs with tight spreads (additional fees may apply). Open your trading account now or learn more about trading commodity CFDs with FXOpen.
This article represents the opinion of the Companies operating under the FXOpen brand only. It is not to be construed as an offer, solicitation, or recommendation with respect to products and services provided by the Companies operating under the FXOpen brand, nor is it to be considered financial advice.
Stay ahead of the market!
Subscribe now to our mailing list and receive the latest market news and insights delivered directly to your inbox.


Latest articles

AI Valuations Are Back in the Spotlight
Artificial intelligence remains the dominant investment theme of 2026, but investors are increasingly questioning whether AI stock valuations are keeping pace with reality.
💰 Big Tech continues to invest at an unprecedented scale, with hyperscaler AI spending projected to exceed $800

AUD/CAD: Months of Indecision — Is a Breakout Finally Coming?
The Australian dollar has clawed back most of its end-of-June losses, when it touched three-month lows against the greenback amid escalating Middle East tensions. Since then, sentiment has improved: the RBA's Assistant Governor Sarah Hunter signalled the board stands ready

USD/JPY: Battling at the Top of the Triangle
On 3 July, Japan's Finance Minister, Satsuki Katayama, stated that the Ministry of Finance remains in close contact with US authorities regarding developments in USD/JPY as the yen traded near its weakest level in almost 40 years. Similar verbal