


FXOpen

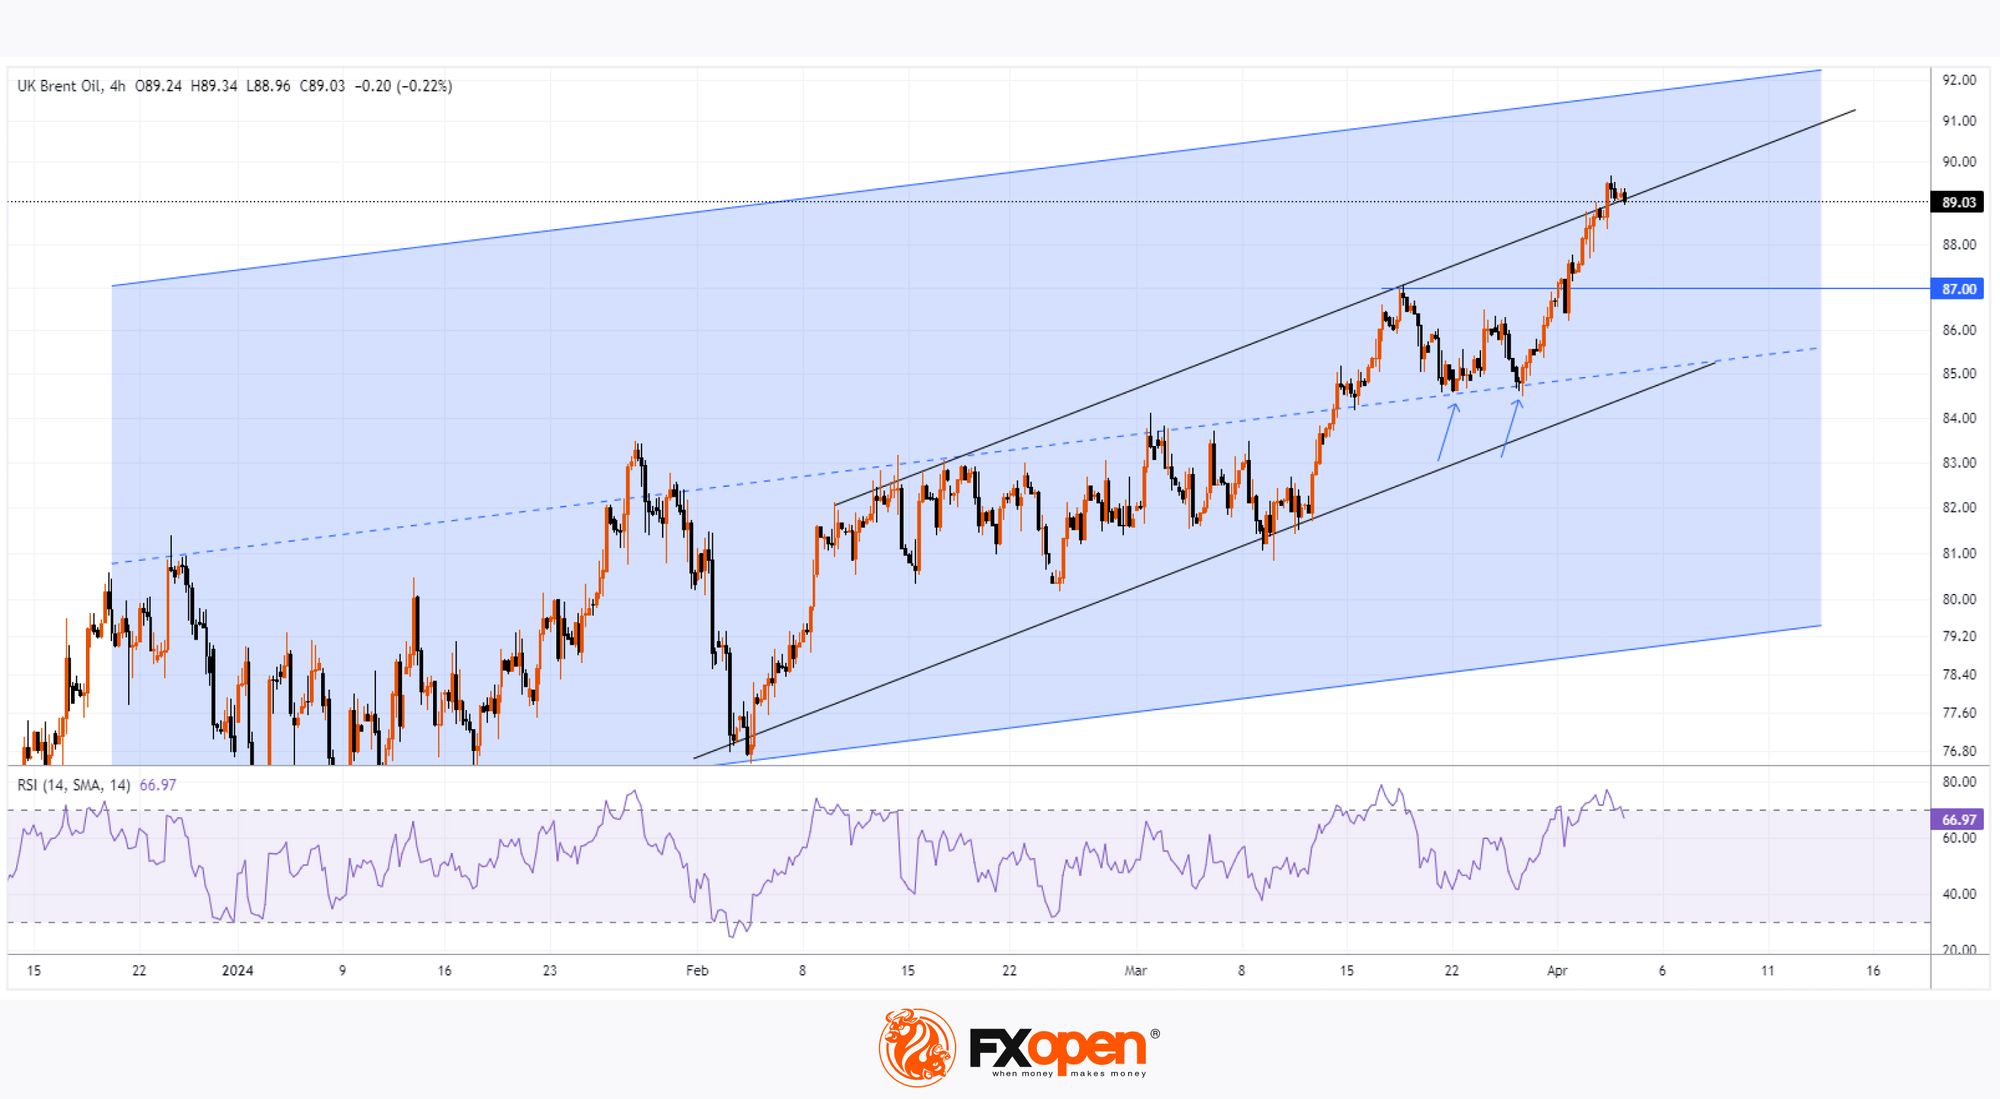
The Brent oil chart today shows that the price has exceeded USD 89 per barrel — this is the highest level since the end of October 2023.
Reasons for strong demand for oil:
→ The OPEC+ meeting ended this week. Exporting countries maintained their policy of limiting oil production unchanged.
→ Ukrainian drone attacks on oil refineries in Russia.
→ Latest data on the strength of the US economy.
Technical analysis of the Brent market shows that:
→ The price moves within the ascending channel (shown in blue), which originates back in 2023.
→ Increased demand in the spring of 2024 led to the fact that the Brent price rose into the upper half of the blue channel and formed a steeper growth trajectory (shown by black lines).
→ The median line of the blue channel acted as support (shown by arrows).
The upper limit of the blue channel is around USD 92 per barrel of Brent and it is possible that the price may reach these values in the next 1-2 months.
However, the prerequisites for a correction are not currently in place after an increase of more than 5% over the last 5 trading sessions:
→ the RSI indicator indicates overbought;
→ the price is at the upper black line.
If a correction scenario is realized in the market, the Brent price may drop to the $87 level, which previously acted as resistance.
Start trading commodity CFDs with tight spreads (additional fees may apply). Open your trading account now or learn more about trading commodity CFDs with FXOpen.
This article represents the opinion of the Companies operating under the FXOpen brand only. It is not to be construed as an offer, solicitation, or recommendation with respect to products and services provided by the Companies operating under the FXOpen brand, nor is it to be considered financial advice.
Stay ahead of the market!
Subscribe now to our mailing list and receive the latest market news and insights delivered directly to your inbox.


Latest articles

Consolidation Ahead of NFP: Commodity Currencies Search for Direction
Commodity-linked currencies have entered a consolidation phase following recent directional moves, as market participants adopt a wait-and-see approach ahead of key US labour market data. Current price action reflects a balance between ongoing demand for the US dollar and attempts

The Real Driver Behind the Dollar Rally: Market Insights with Gary Thomson
The US dollar has been firm, but the drivers behind the move may be more complex than they first appear.
While geopolitical tension and shifts in risk sentiment play a role, current price behaviour seems increasingly influenced by inflation expectations

EUR/USD and USD/CHF Pull Back: Market Reacts to Fundamentals
European currencies have shown a recovery in recent trading sessions after their recent decline, displaying early signs of a reversal. The US dollar is weakening amid expectations surrounding upcoming US macroeconomic data, while market participants are reassessing their short-term positions