FXOpen

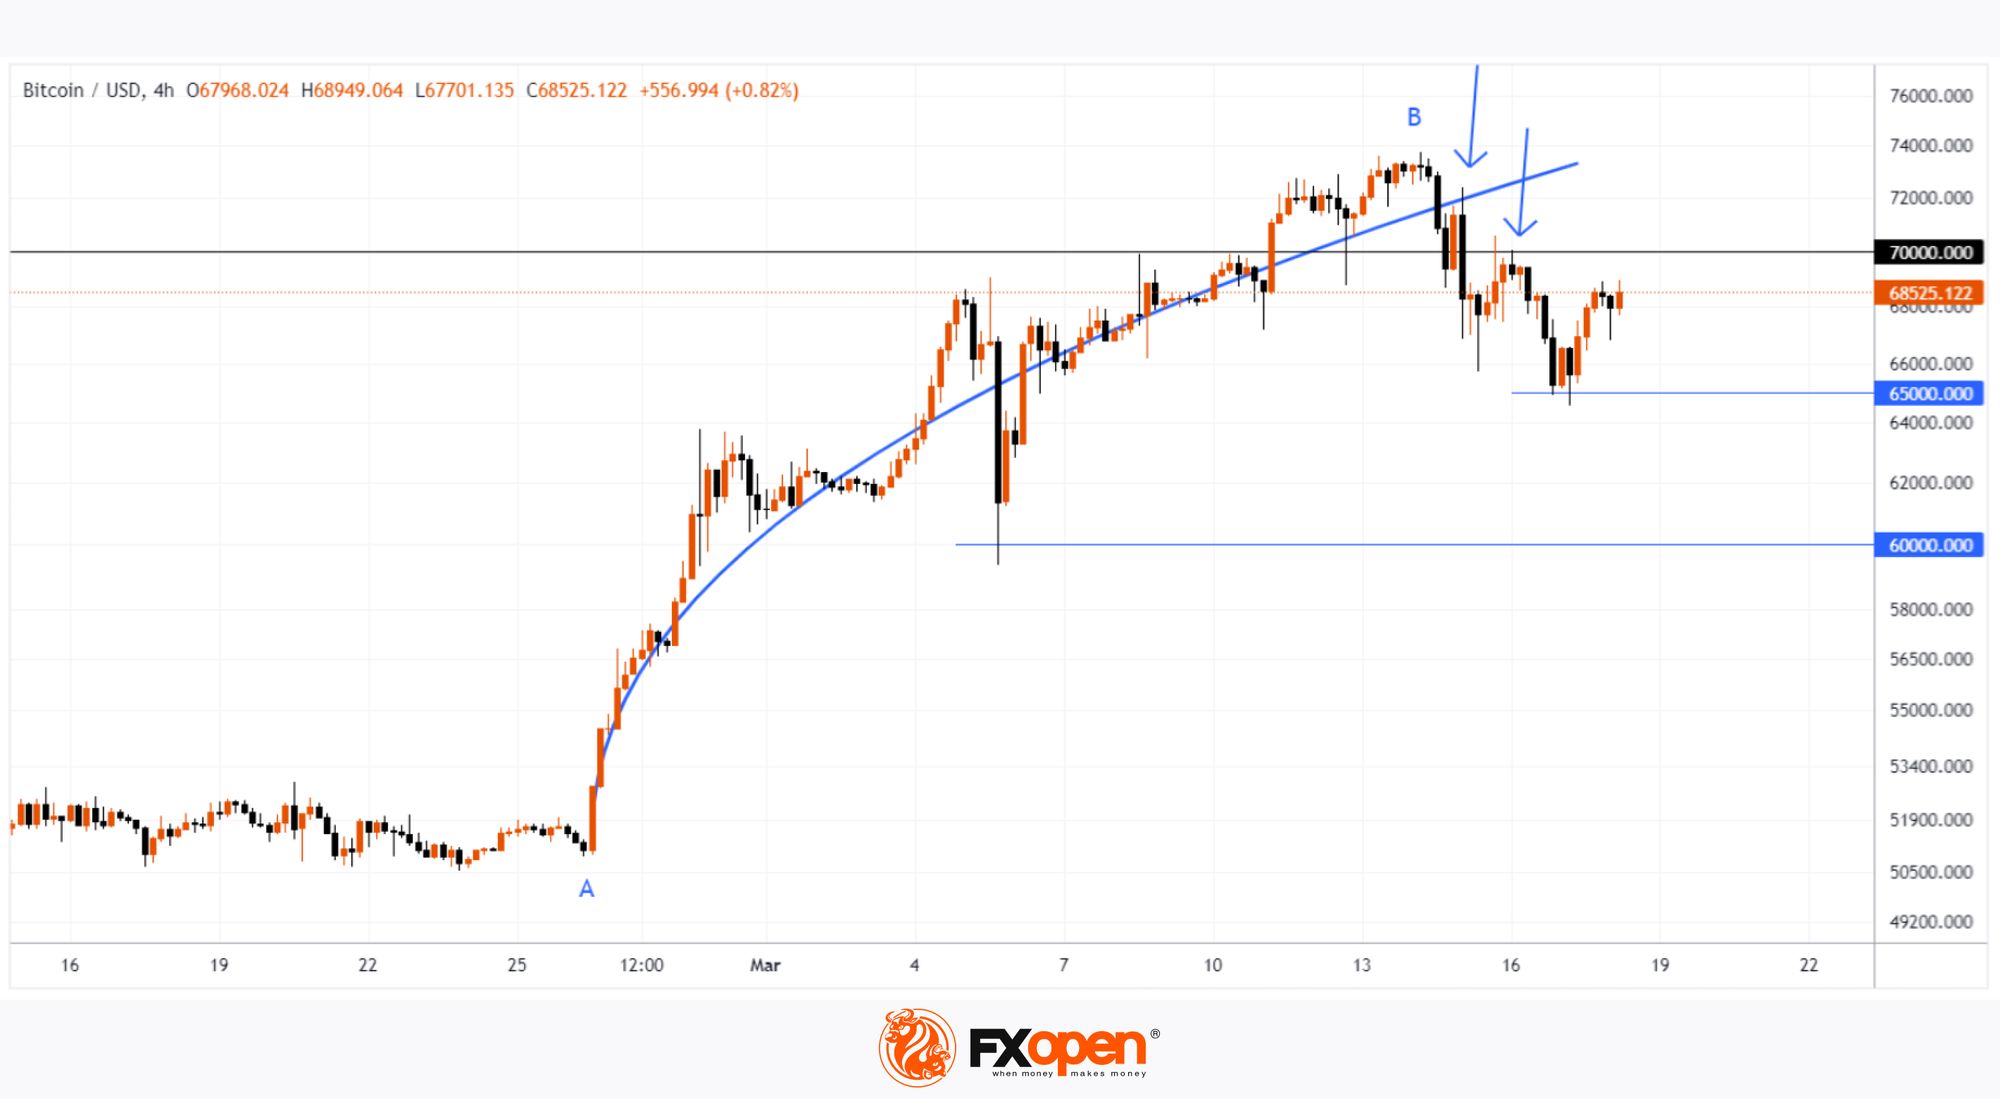
On February 26 (A), a strong bullish impulse started in the Bitcoin market. Its trajectory is visually described by a blue line. The price of bitcoins developed along it — this can be interpreted in such a way that market participants agreed that the value of the cryptocurrency was increasing.
If the price of Bitcoin deviated from the blue line, it was only for a short period of time. For example, to pierce the psychological level of USD 60,000 on March 5th.

However, the bullish momentum changed on March 15th, and this can be seen on the BTC/USD chart today:
→ the blue line began to work as resistance (shown by the first arrow);
→ the level of USD 70,000 also began to act as resistance (shown by the second arrow).
BTC price briefly deviated from breaking through the psychological USD 65,000 level - but it appears that due to said resistances, bulls may now have trouble getting Bitcoin price back onto the upward trajectory shown by the blue line.
This could mean that the market's consensus on the value of BTC has changed - the chart suggests that a price of over USD 70k per Bitcoin may be considered overpriced (not surprising after A→B's rise of over 40% in 14 days).
On the other hand, demand remains high ahead of the halving (scheduled for April 19).
According to Matt Hougan (a top executive at Bitwise, one of the BTC ETF providers), about 40% of independent registered financial advisors at Barron's Summit owned Bitcoin. And this number among their clients is about 5-10%, which leaves potential for further growth.
Matt Hougan also noted the growing concern about the huge US government debt, and Bitcoin in this case acts as an insurance asset.
Given the strong fundamentals and signs of technical weakness near the last historical high, it is reasonable to assume that the price of Bitcoin may form some kind of consolidation zone around USD 70,000, thereby suggesting the levels that most market participants consider a fair price for Bitcoin at the moment.
FXOpen offers the world's most popular cryptocurrency CFDs*, including Bitcoin and Ethereum. Floating spreads, 1:2 leverage — at your service (additional fees may apply). Open your trading account now or learn more about crypto CFD trading with FXOpen.
*Important: At FXOpen UK, Cryptocurrency trading via CFDs is only available to our Professional clients. They are not available for trading by Retail clients. To find out more information about how this may affect you, please get in touch with our team.
This article represents the opinion of the Companies operating under the FXOpen brand only. It is not to be construed as an offer, solicitation, or recommendation with respect to products and services provided by the Companies operating under the FXOpen brand, nor is it to be considered financial advice.
Stay ahead of the market!
Subscribe now to our mailing list and receive the latest market news and insights delivered directly to your inbox.


