


FXOpen

On 9 August, our analysis of the long-term BTC/USD chart noted that Bitcoin's price was at a crossroads, moving within the bounds of two channels:
→ A bullish channel (shown in blue), which began forming in 2023 on the back of Bitcoin ETF approval rumours;
→ A bearish channel (shown in red), which started taking shape in March 2024, when the effect of Bitcoin ETF approval (which actually occurred on 11 January) seemed to have reached its peak, helping Bitcoin reach an all-time high.
Which path has the price taken?
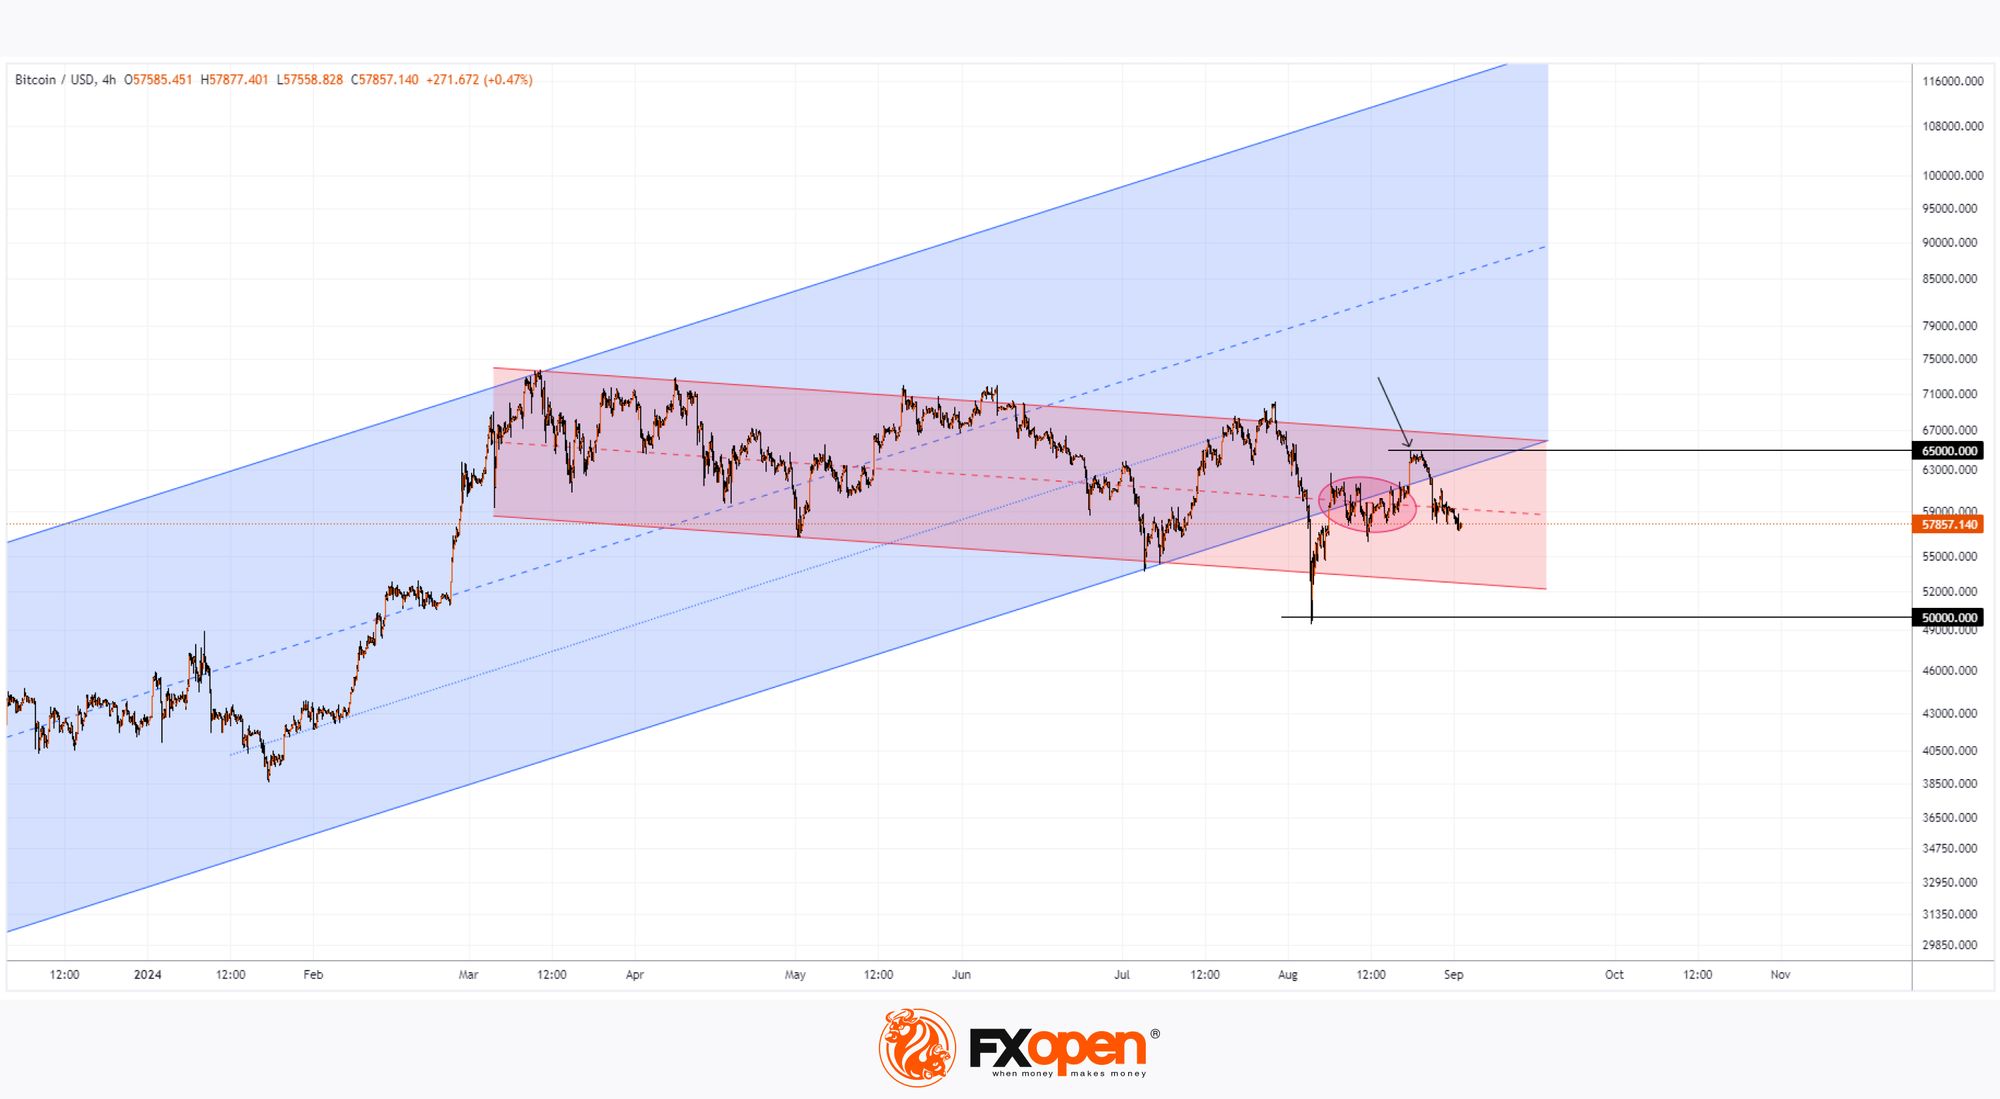
Current technical analysis of the BTC/USD chart indicates that bearish arguments are now more compelling:
→ Since 9 August, attempts to return to the bullish channel have been sporadic and lack continuity;
→ Conversely, the price shows signs of "magnetism" (shown in red oval) towards the median line of the descending channel, confirming its relevance;
→ The growth attempt on 23 August faced resistance at the psychological level of $65k (shown with an arrow).
The decline in BTC/USD in late August was further impacted by Binance’s freezing of accounts linked to Palestinian military groups, undermining Bitcoin's image as an anonymous and decentralised currency.
Under these conditions, it is reasonable to expect a bearish autumn, with more signs of weakness for buyers on the BTC/USD chart. It is possible that by the end of the year, we might see a new push towards the $50k level.
FXOpen offers the world's most popular cryptocurrency CFDs*, including Bitcoin and Ethereum. Floating spreads, 1:2 leverage — at your service (additional fees may apply). Open your trading account now or learn more about crypto CFD trading with FXOpen.
*Important: At FXOpen UK, Cryptocurrency trading via CFDs is only available to our Professional clients. They are not available for trading by Retail clients. To find out more information about how this may affect you, please get in touch with our team.
This article represents the opinion of the Companies operating under the FXOpen brand only. It is not to be construed as an offer, solicitation, or recommendation with respect to products and services provided by the Companies operating under the FXOpen brand, nor is it to be considered financial advice.
Stay ahead of the market!
Subscribe now to our mailing list and receive the latest market news and insights delivered directly to your inbox.


Latest articles

European Currencies Strengthen: Dollar Under Pressure Following Ceasefire News
European currencies posted solid gains, while the US dollar came under pressure amid easing geopolitical tensions following reports of a two-week ceasefire agreement between the United States and Iran. Reduced demand for so-called safe-haven assets acted as the primary driver,

Brent Crude Price: Ceasefire Wipes Out the Geopolitical Premium
For several weeks, the oil market remained directly influenced by the US-Iran tensions. Threats to close the Strait of Hormuz kept Brent prices within the $97–110 range. Overnight on 8 April, the parties announced a two-week ceasefire, and the
