


FXOpen

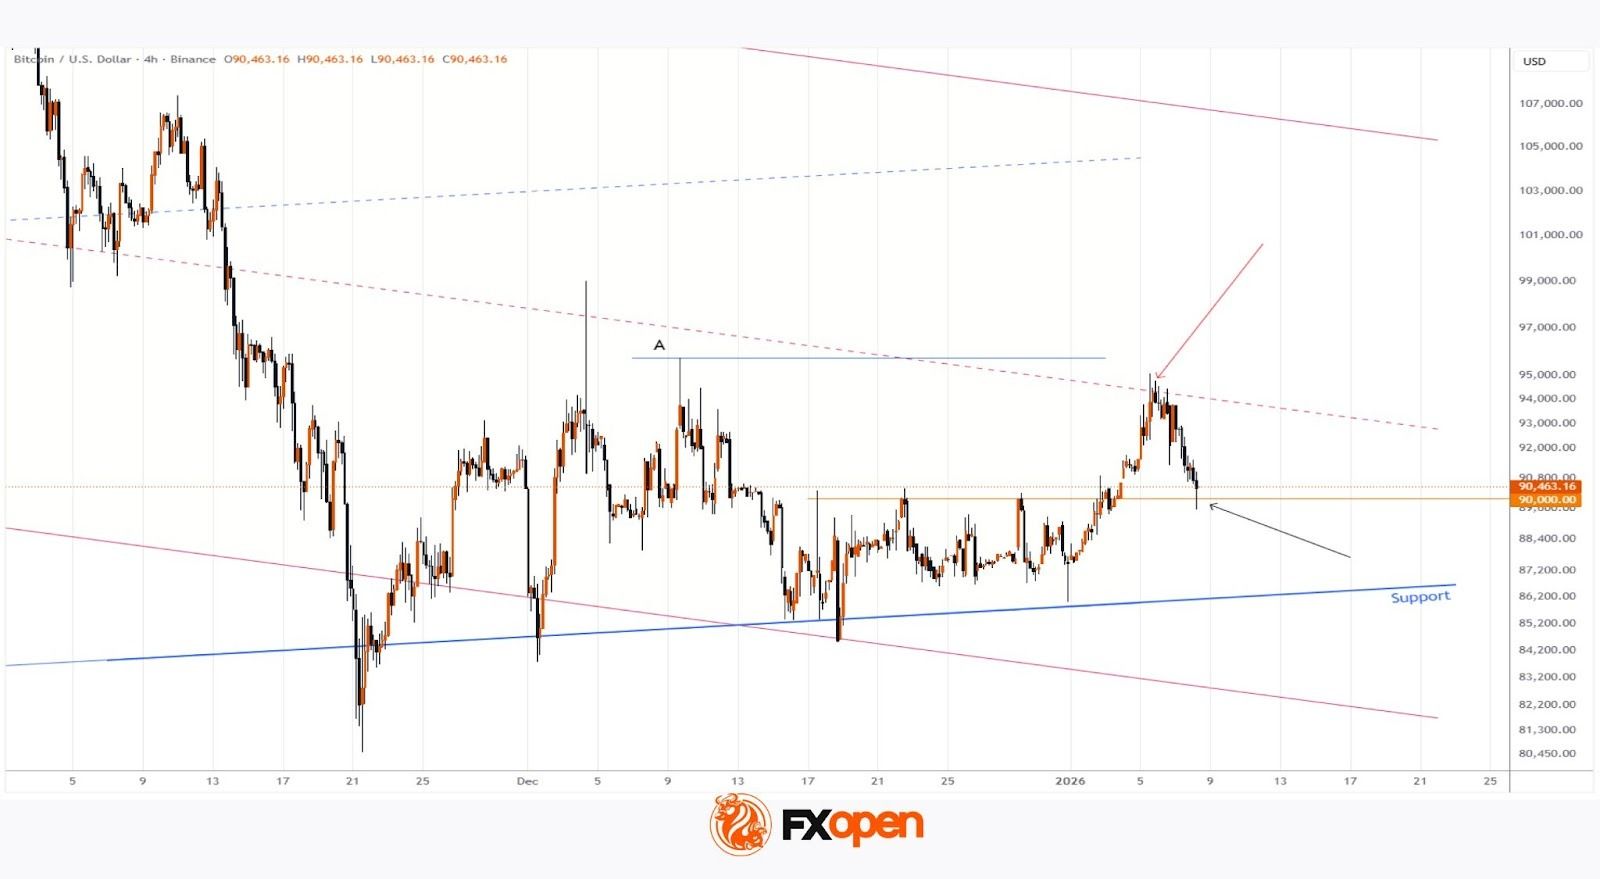
As the BTC/USD chart shows, the price of the leading cryptocurrency briefly dipped below the psychological $90k level this morning, despite trading above $94k earlier in the week.
Why is Bitcoin falling today?
Among the key drivers, the following stand out:
→ Decline in the geopolitical risk premium. Bitcoin’s rise earlier this week was supported by news of Maduro’s detention and US actions in Venezuela. However, this factor is now losing relevance.
→ Ahead of key macroeconomic data. On Friday, the US Nonfarm Payrolls report is due to be released. Recent ADP Employment Change data suggest that Friday’s figures could point to a recession in the US. In such an environment, traders may seek to reduce exposure to risk assets.
Technical analysis of the BTC/USD chart
On 18 December, we discussed Bitcoin’s price action within a system of two channels, which remain relevant. This week, as indicated by the red arrow:
→ the channel median acted as resistance;
→ on the CME exchange, futures prices posted a false bullish breakout above the December high (A).
These observations suggest that bears retain strength in the medium term. However, a sharp rebound from the $90k level (marked by the black arrow) points to renewed bullish activity. Therefore, if bears are indeed targeting a break below the lower boundary of the ascending channel, they will need to exert considerable pressure to push BTC/USD below this key psychological level.
FXOpen offers the world's most popular cryptocurrency CFDs*, including Bitcoin and Ethereum. Floating spreads, 1:2 leverage — at your service (additional fees may apply). Open your trading account now or learn more about crypto CFD trading with FXOpen.
*Important: At FXOpen UK, Cryptocurrency trading via CFDs is only available to our Professional clients. They are not available for trading by Retail clients. To find out more information about how this may affect you, please get in touch with our team.
This article represents the opinion of the Companies operating under the FXOpen brand only. It is not to be construed as an offer, solicitation, or recommendation with respect to products and services provided by the Companies operating under the FXOpen brand, nor is it to be considered financial advice.
Stay ahead of the market!
Subscribe now to our mailing list and receive the latest market news and insights delivered directly to your inbox.


Latest articles

Weak Data Weigh on the Dollar: Market Awaits Trend Confirmation
The US dollar is retreating from recent highs, moving into a moderate correction after a prolonged period of gains. Pressure on the currency is building amid weaker-than-expected macroeconomic data, while market participants adopt a wait-and-see approach ahead of key labour

Market Analysis: EUR/USD Aims Recovery While USD/JPY Gives Back Recent Gains
EUR/USD is recovering losses from 1.1450. USD/JPY is correcting gains from 160.50 and might decline further below 158.00.
Important Takeaways for EUR/USD and USD/JPY Analysis Today
· The Euro struggled to stay in a

European Currencies Decline: Pound Hits New Lows, Euro Under Pressure
European currencies continue to weaken against the US dollar amid rising geopolitical tensions and increased demand for safe-haven and liquid assets. Market participants are reducing exposure to riskier instruments, putting pressure on both the euro and the pound. Additional support