


BTC/USD price analysis: The Price of Bitcoin Collapses by about 8% in One Day
FXOpen

This morning the BTC/USD price is near 26,500, the lowest price since mid-June.
What is the reason for this? Among the drivers of the decline may be information that Elon Musk's SpaceX company intends to sell (or has already sold) USD 373 million worth of bitcoins. However, the collapse could have been influenced more by technical than by fundamental factors.
On August 8, we wrote that the ADX indicator fell to a minimum since the beginning of the year — that is, the market was in a protracted flat. It was a vulnerable position for the birth of a new impulse.
Note that the USD 30K psychological level acted as resistance in August — the price was not able to stay higher for long. It was logical to assume that the bears would try to take the initiative. And it happened this week — notice the widening bearish candles on August 15-16 as we approach the 28,800 support.
The decline triggered a cascade of stop-losses (more than USD 1 billion worth of positions on cryptocurrency exchanges were liquidated), which intensified the selling wave.
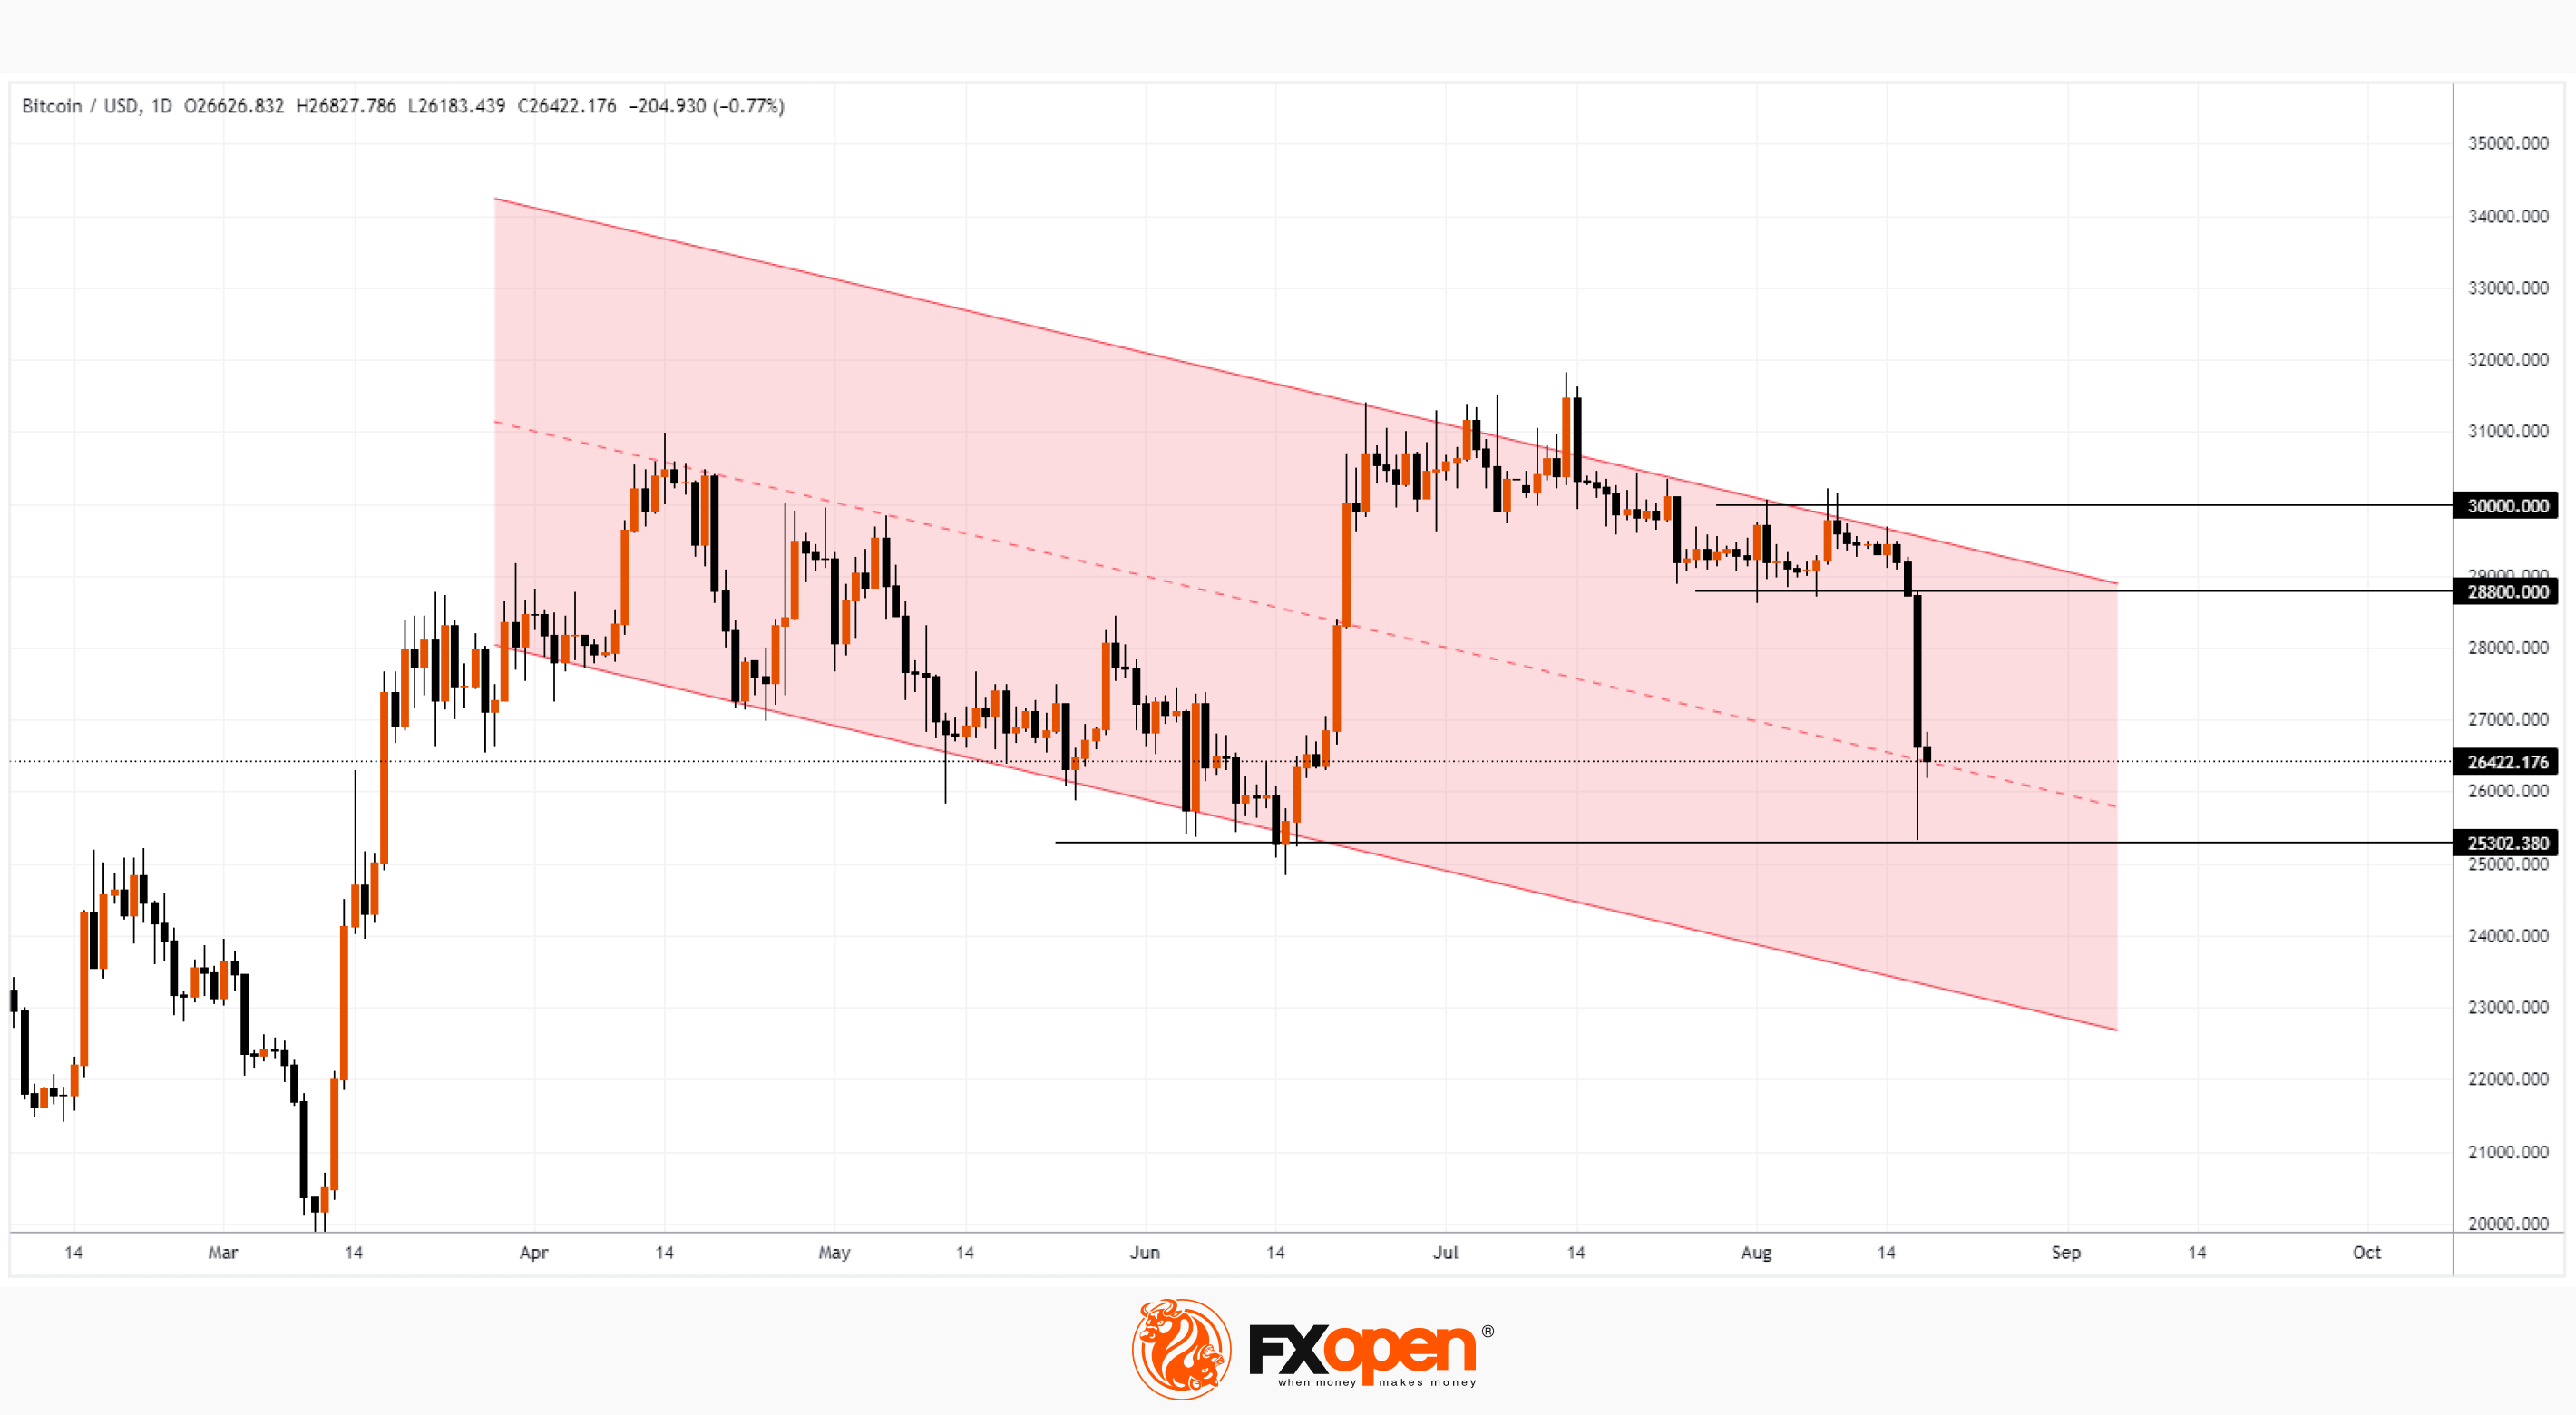
The chart shows that the price of BTC/USD today is near the median line of the descending channel, where the demand for cheaper bitcoins has balanced the supply. If the price continues to develop within this channel, we can see a new attempt to break through the psychological level of USD 25,000, which in mid-June led to a sharp increase in the price of bitcoins.
FXOpen offers the world's most popular cryptocurrency CFDs*, including Bitcoin and Ethereum. Floating spreads, 1:2 leverage — at your service (additional fees may apply). Open your trading account now or learn more about crypto CFD trading with FXOpen.
*Important: At FXOpen UK, Cryptocurrency trading via CFDs is only available to our Professional clients. They are not available for trading by Retail clients. To find out more information about how this may affect you, please get in touch with our team.
This article represents the opinion of the Companies operating under the FXOpen brand only. It is not to be construed as an offer, solicitation, or recommendation with respect to products and services provided by the Companies operating under the FXOpen brand, nor is it to be considered financial advice.
Stay ahead of the market!
Subscribe now to our mailing list and receive the latest market news and insights delivered directly to your inbox.


Latest articles

AI Valuations Are Back in the Spotlight
Artificial intelligence remains the dominant investment theme of 2026, but investors are increasingly questioning whether AI stock valuations are keeping pace with reality.
💰 Big Tech continues to invest at an unprecedented scale, with hyperscaler AI spending projected to exceed $800

AUD/CAD: Months of Indecision — Is a Breakout Finally Coming?
The Australian dollar has clawed back most of its end-of-June losses, when it touched three-month lows against the greenback amid escalating Middle East tensions. Since then, sentiment has improved: the RBA's Assistant Governor Sarah Hunter signalled the board stands ready

USD/JPY: Battling at the Top of the Triangle
On 3 July, Japan's Finance Minister, Satsuki Katayama, stated that the Ministry of Finance remains in close contact with US authorities regarding developments in USD/JPY as the yen traded near its weakest level in almost 40 years. Similar verbal