FXOpen

According to Bloomberg, President Donald Trump raised the possibility of imposing tariffs on China during his second day in office.
“We’re considering a 10% tariff on China,” Trump announced during a White House event on Tuesday, indicating February 1 as a potential start date.
During his election campaign, Trump had mentioned tariffs as high as 60%, and the prospect of transitioning from campaign rhetoric to real action is driving bearish sentiment.
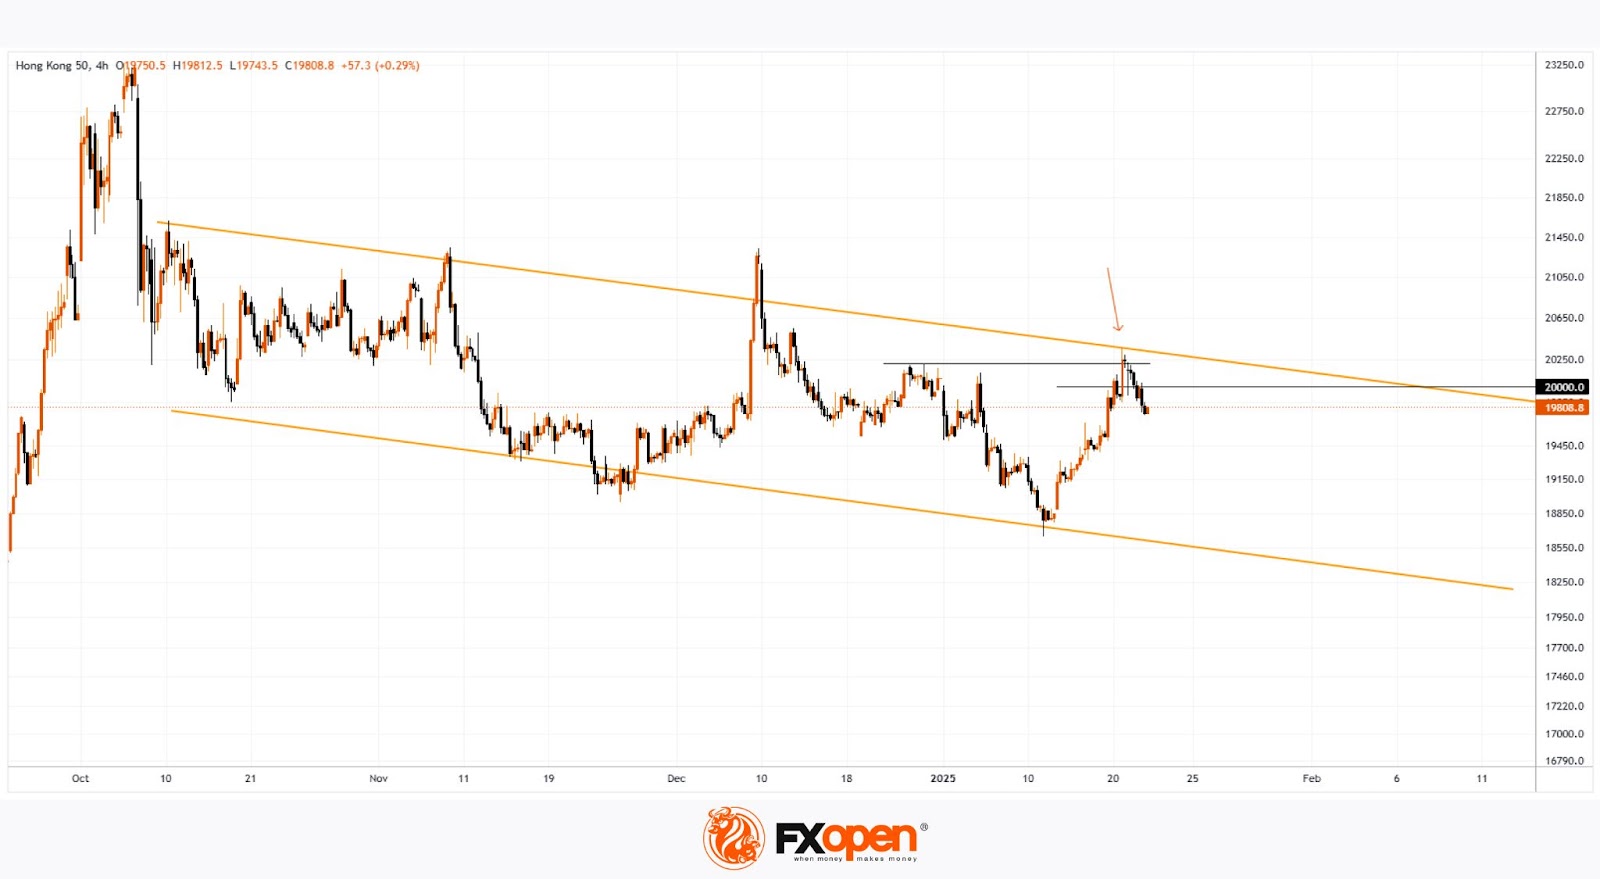
According to the technical analysis of the Hang Seng Index (Hong Kong 50 on FXOpen), price fluctuations have been forming a downward trend since October. The formation of the 2025 peak (indicated with an arrow) signals bearish tendencies, as the price failed to hold above:
→ The previous high from December, near 20,210, indicating a false breakout.
→ The psychological level of 20,000.
If Trump follows through on his promises, it is reasonable to anticipate that bears may take control of lower levels in the coming sessions.
Trade global index CFDs with zero commission and tight spreads (additional fees may apply). Open your FXOpen account now or learn more about trading index CFDs with FXOpen.
This article represents the opinion of the Companies operating under the FXOpen brand only. It is not to be construed as an offer, solicitation, or recommendation with respect to products and services provided by the Companies operating under the FXOpen brand, nor is it to be considered financial advice.
Stay ahead of the market!
Subscribe now to our mailing list and receive the latest market news and insights delivered directly to your inbox.


Latest articles
Oracle (ORCL) Shares Jump Above $160
Following a strong earnings report, Oracle shares surged above $160, marking roughly a 1.5-month high:
→ Earnings per share: expected $1.70, actual $1.79;
→ Revenue: expected $16.7bn, actual $17.2bn.
This is the first quarter in 15 years
USD/JPY Approaches Key Resistance Level
The USD/JPY chart shows a bullish trend at the start of March, influenced by the escalation of military activity in the Middle East.
On one hand, the US dollar is strengthening due to increased demand for safe-haven assets. On