


CNBC Pro Poll: Strategists See S&P 500 Price Drop before Year-end
FXOpen

From July 3 to July 7, 15 reputable strategists were interviewed (among them - Bank of America Chief Equity Strategist Savita Subramanian, Charles Schwab Chief Investment Strategist Liz Ann).
9 respondents suggested that the price of the S&P 500 in the 2nd half of the year will fall below current levels. Most of the rest suggested that it would rise, but only slightly. The median opinion is that the S&P 500 forecast for the end of 2023 is 4,255 points (below the current level of 4,444 points).
The reason for pessimism is the lack of growth drivers, which were the boom associated with AI in the first half of the year; against its background, the S&P rose by 15.9%. According to UBS Global Wealth Management investment director Mark Hefele, the main risk for the stock market is that the US Federal Reserve will continue to raise rates, consumer spending will begin to decline, and the US economy will face a recession — eventually this will lead to a hard landing.
Since Monday, the price of S&P 500 has been showing growth, indicating the optimism of market participants regarding inflation values — the news will be published today, at 15:30 GMT+3.
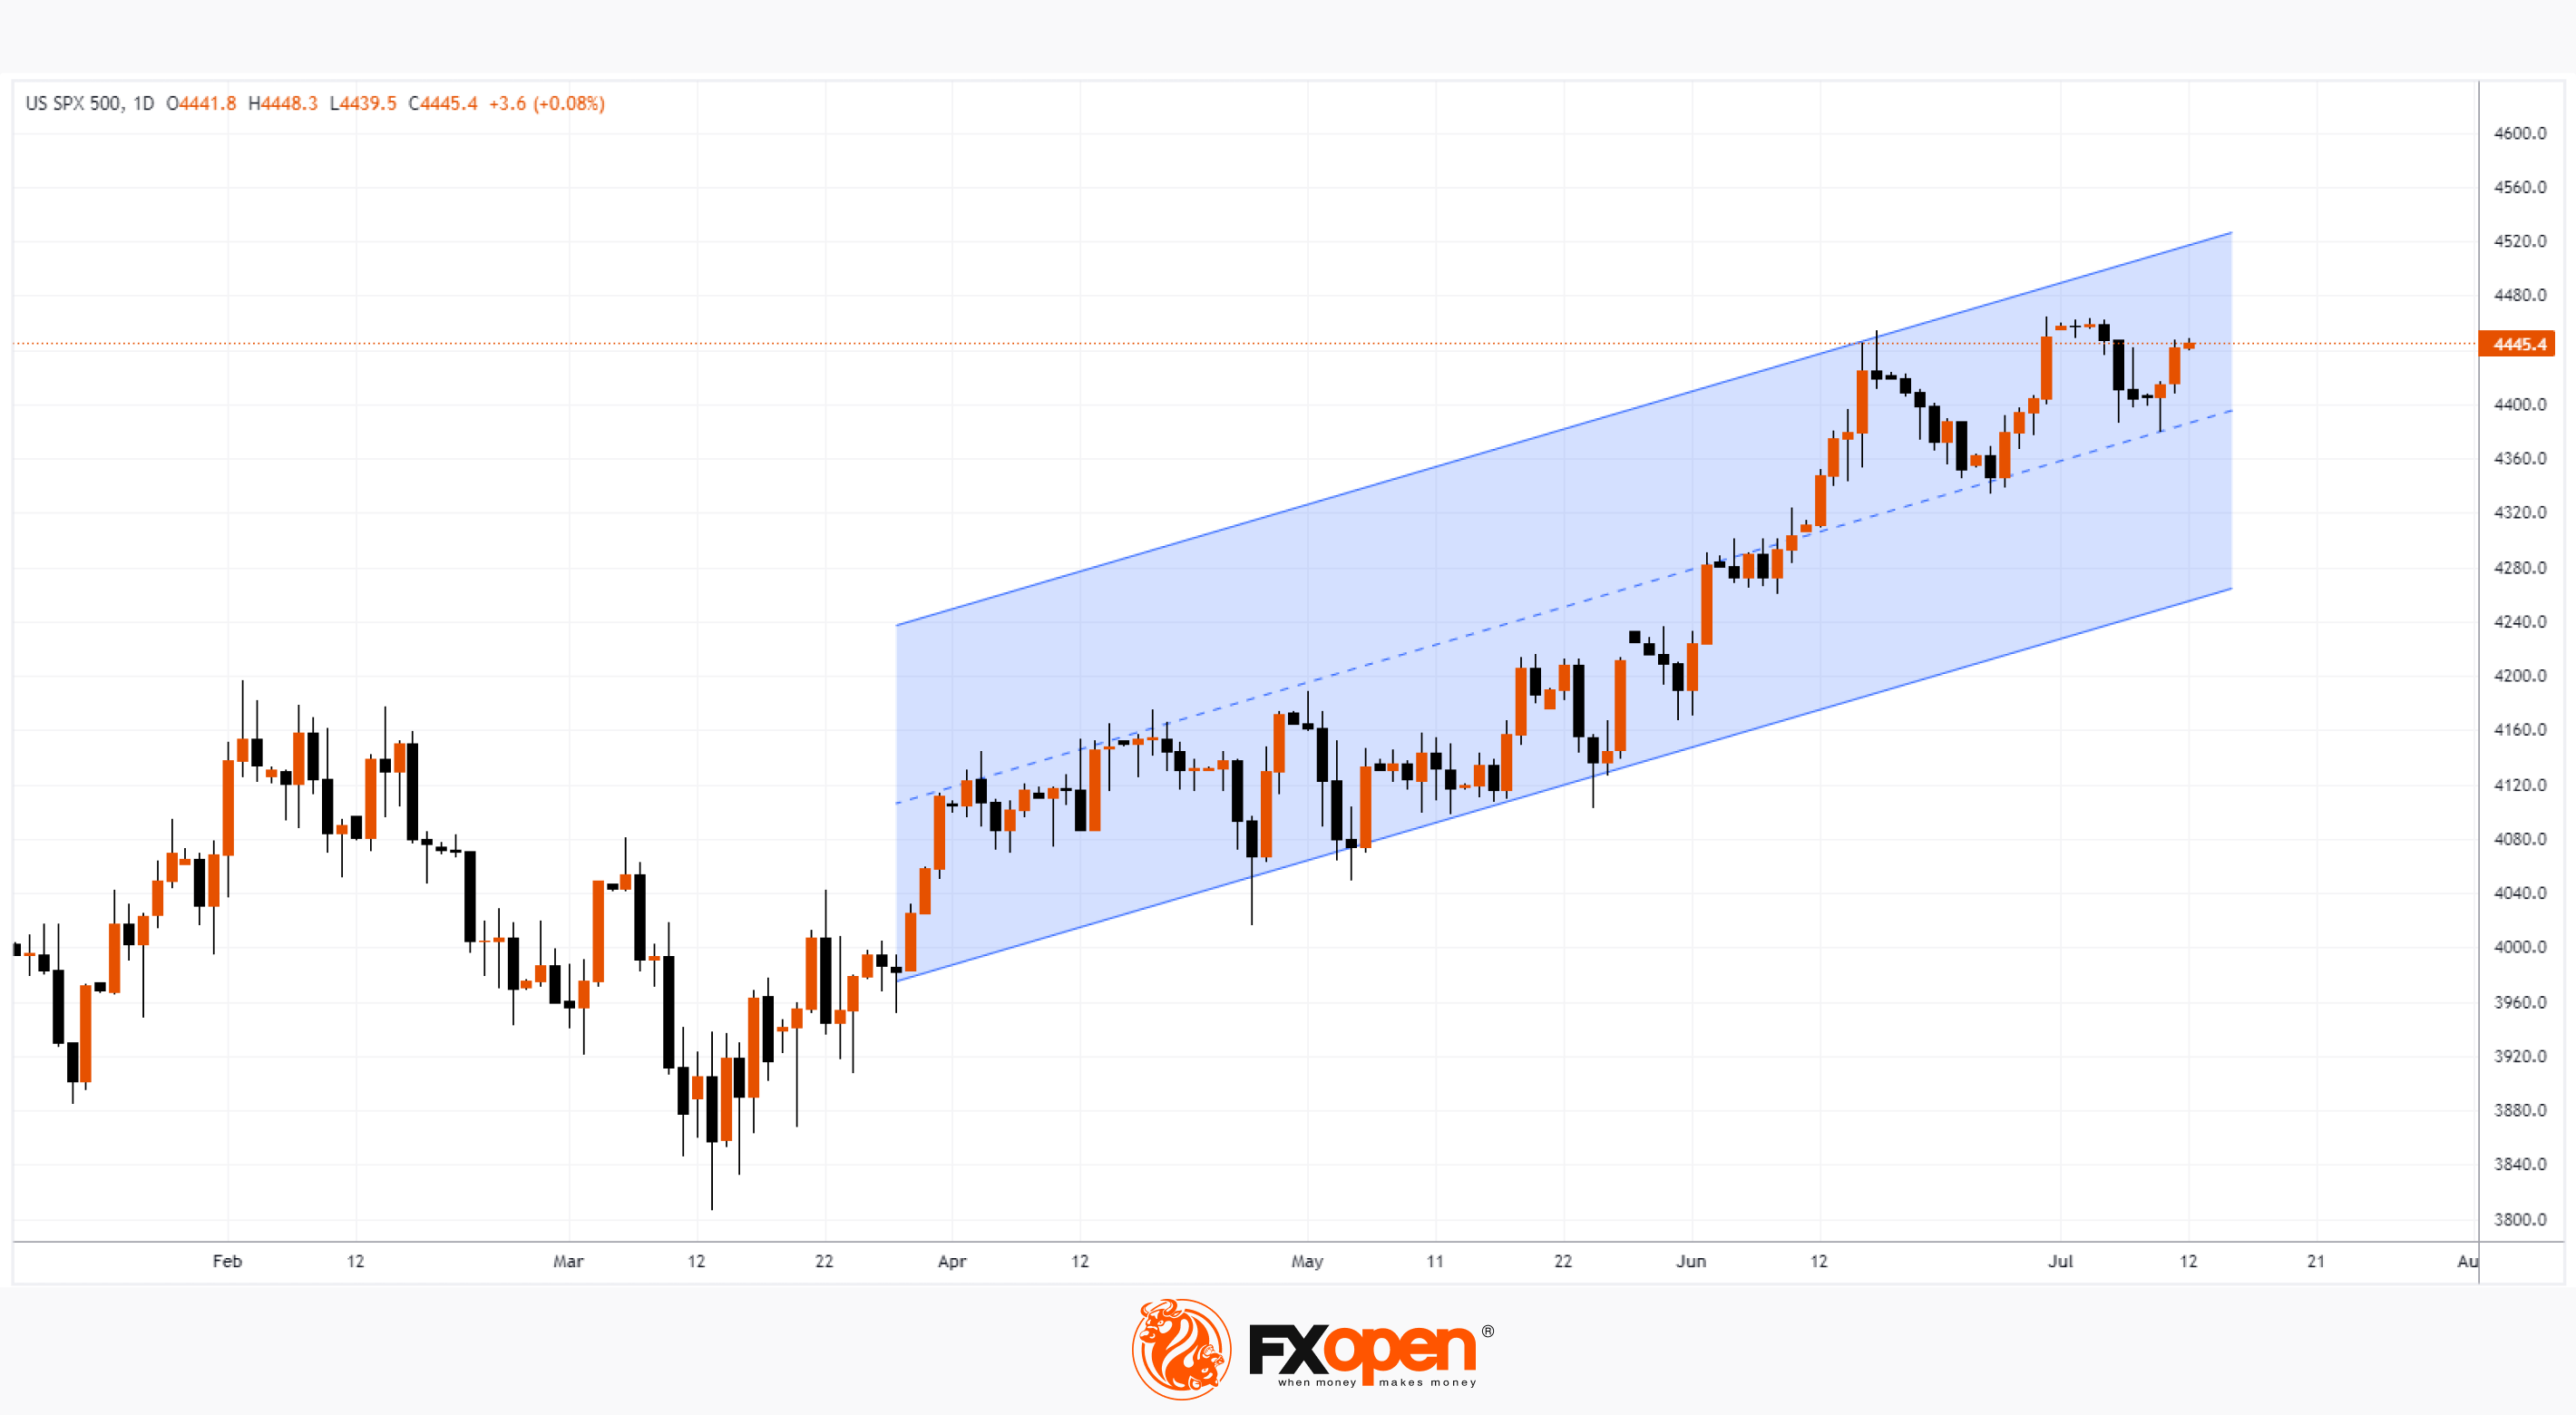
The chart shows that the price of the S&P 500 is rising within the channel shown in blue. In this case, the median line acts as a support.
However, disappointing inflation data, as well as the first data of the company reporting season for the Q2, may turn the mood to bearish, thereby increasing the likelihood of investment strategists' forecast being realized.
Trade global index CFDs with zero commission and tight spreads (additional fees may apply). Open your FXOpen account now or learn more about trading index CFDs with FXOpen.
This article represents the opinion of the Companies operating under the FXOpen brand only. It is not to be construed as an offer, solicitation, or recommendation with respect to products and services provided by the Companies operating under the FXOpen brand, nor is it to be considered financial advice.
Stay ahead of the market!
Subscribe now to our mailing list and receive the latest market news and insights delivered directly to your inbox.


Latest articles

EUR/USD Eyes Gains As USD/CHF Weakness Deepens Again
EUR/USD started a fresh increase above 1.1700 and 1.1720. USD/CHF declined further and is now struggling below 0.7835.
Important Takeaways for EUR/USD and USD/CHF Analysis Today
· The Euro started a decent increase from

Apple: Earnings Day Above the Activity Zone
On 30 April, after the market close, Apple Inc. will release its financial results for the second quarter of fiscal 2026. The consensus forecast, based on estimates from 31 analysts, points to revenue of around $109.7 billion, with expected

USD/JPY and USD/CHF Near Key Levels: The Dollar Supported by the Fed
The US dollar continues to trend upwards following the Federal Reserve meeting, drawing support from the regulator’s moderately hawkish stance and comments by Jerome Powell. Markets interpret the Fed’s rhetoric as a signal that restrictive policy is likely