


FXOpen
On 23 October, Coca-Cola (KO) released its third-quarter earnings, which exceeded forecasts:
→ Earnings per share (EPS): Actual = $0.77; Expected = $0.74
→ Gross revenue: Actual = $11.95 billion; Expected = $11.69 billion
Despite these positive results, KO's share price saw a sharp decline, likely due to market concerns about fourth-quarter sales forecasts, which face risks associated with currency fluctuations.
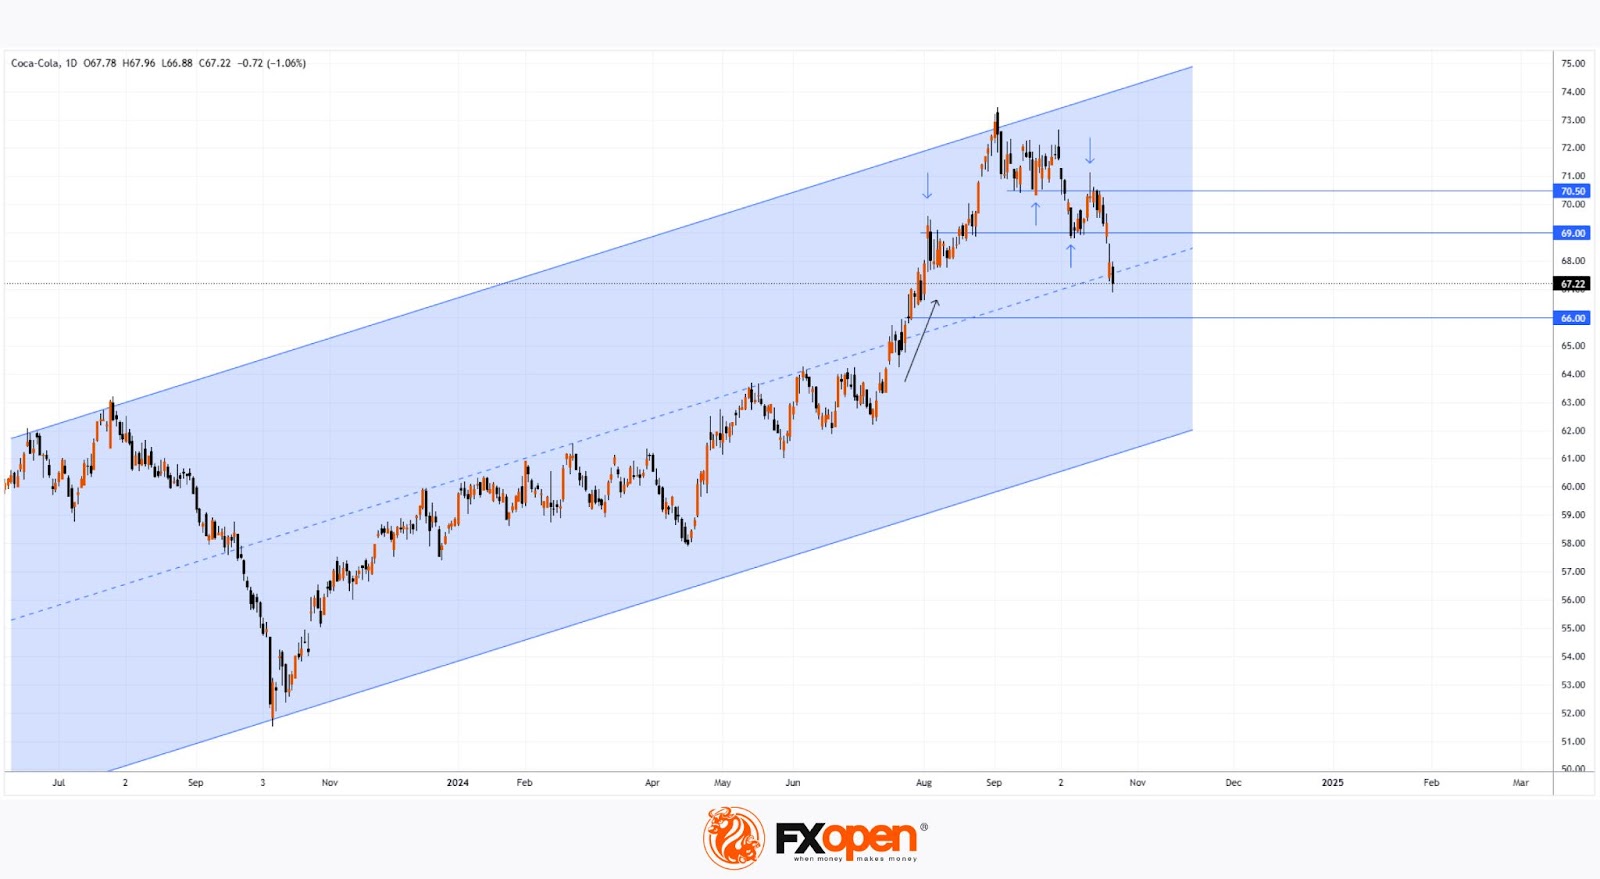
Technical Analysis of Coca-Cola (KO) Stock Chart:
→ In 2024, price fluctuations formed an upward channel (shown in blue), with a notable surge in early August (marked by a black arrow), even as broader markets were under pressure from recession fears and the decline of the Japanese stock market. This suggests that buyer interest around the $66 level remains strong.
→ Since then, the price has oscillated between $69 and $70.50, with these levels alternately serving as support and resistance (marked by blue arrows), as well as testing the upper boundary of the blue channel.
→ Currently, KO’s price sits near the midpoint of the blue channel, indicating potential support at this level, which could significantly slow the downward momentum observed post-earnings.
Furthermore, bulls may attempt to resume the upward trend within the blue channel, with $69 acting as a key level to test the strength of demand.
Analysts remain optimistic. According to TipRanks data:
→ 11 of 15 analysts recommend buying KO stock;
→ The average KO price target is $75.46 over the next 12 months.
Buy and sell stocks of the world's biggest publicly-listed companies with CFDs on FXOpen’s trading platform. Open your FXOpen account now or learn more about trading share CFDs with FXOpen.
This article represents the opinion of the Companies operating under the FXOpen brand only. It is not to be construed as an offer, solicitation, or recommendation with respect to products and services provided by the Companies operating under the FXOpen brand, nor is it to be considered financial advice.
Stay ahead of the market!
Subscribe now to our mailing list and receive the latest market news and insights delivered directly to your inbox.


Latest articles

Market Analysis: GBP/USD Dips Further As EUR/GBP Regains Traction
GBP/USD failed to climb above 1.3500 and corrected some gains. EUR/GBP started a decent increase and might aim for more gains above 0.8700.
Important Takeaways for GBP/USD and EUR/GBP Analysis Today
· The British Pound


Market Insights with Gary Thomson: Oil, US Retail Sales & NFP in Focus
In this video, we’ll explore the key economic events and market trends, shaping the financial landscape. Get ready for insights into financial markets to help you navigate the week ahead. Let’s dive in!
In this episode of Market