


FXOpen

On 15 October, in our analysis of Coinbase (COIN) stock:
→ we established a long-term upward channel (shown in blue),
→ speculating that bulls were aiming to renew the trend from its lower boundary.
Then, on 30 October, Coinbase released its Q3 performance report to investors. Results fell short of expectations, leading to a decline in COIN’s price (indicated by a red arrow).
Despite this, today COIN’s stock price is providing investors with renewed optimism as it approaches its record high, currently around the $282.00 mark.
In this move, the price broke through:
→ the $220 resistance level,
→ a red trendline shown on the chart.
Key drivers of COIN's recent price increase:
→ the Fed's interest rate cut,
→ Trump’s election win, which market participants view as a positive signal.
What lies ahead?
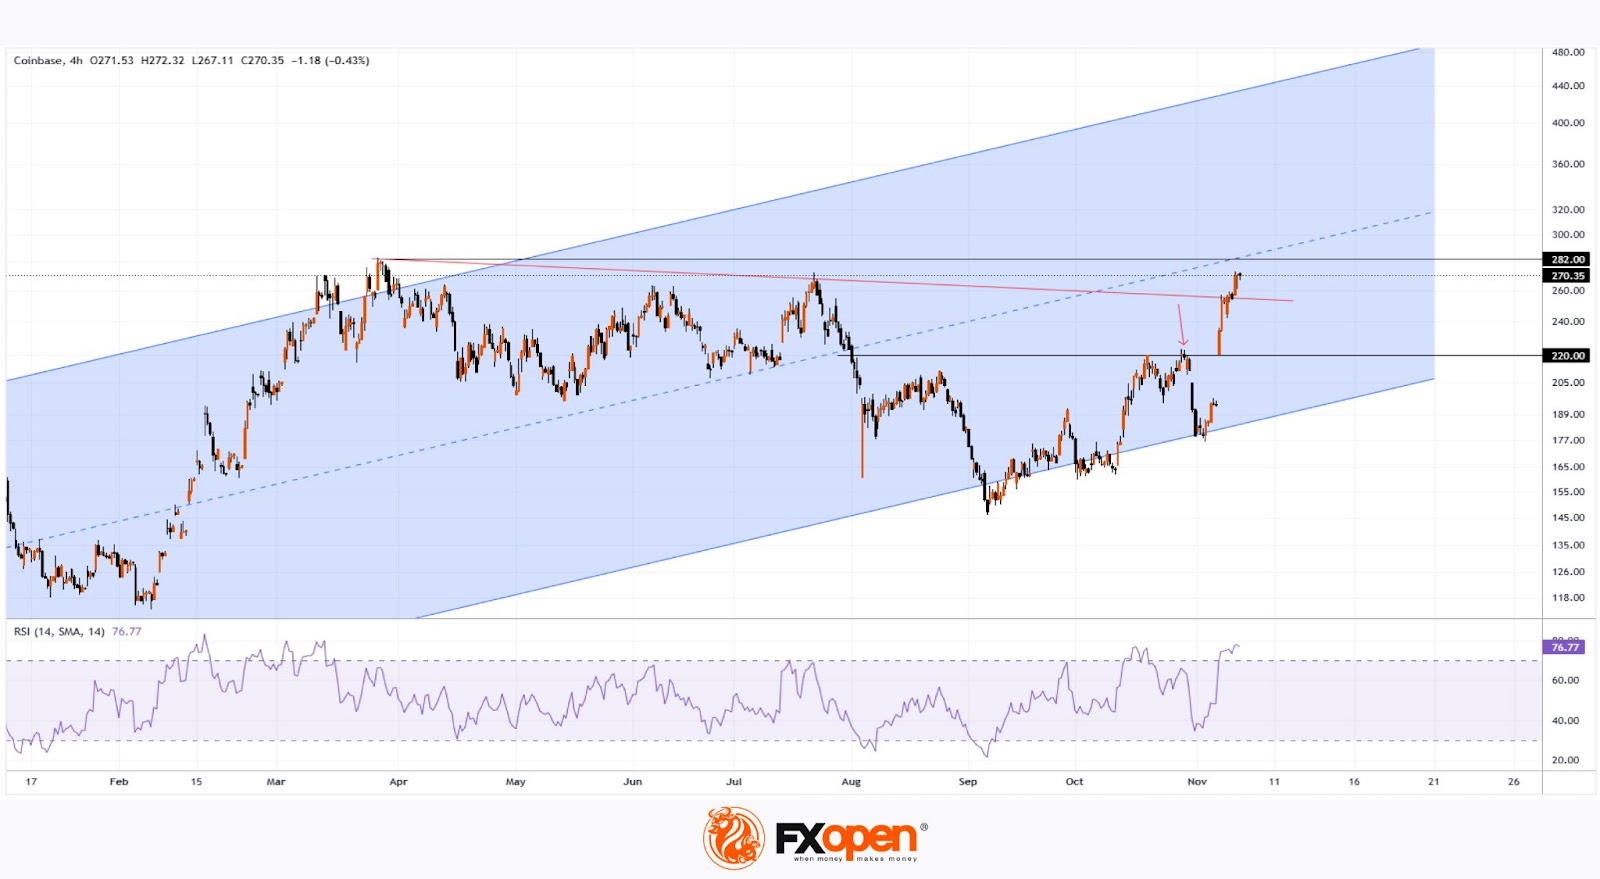
The 4-hour technical analysis of COIN suggests that at the historical high, the price meets a median line. This raises the likelihood that the upward momentum may stall, leading to possible outcomes such as:
→ price stabilisation (as supply and demand typically balance around the median),
→ a corrective movement following the sharp rise, which seems fitting given the RSI indicator pointing to overbought conditions.
Buy and sell stocks of the world's biggest publicly-listed companies with CFDs on FXOpen’s trading platform. Open your FXOpen account now or learn more about trading share CFDs with FXOpen.
This article represents the opinion of the Companies operating under the FXOpen brand only. It is not to be construed as an offer, solicitation, or recommendation with respect to products and services provided by the Companies operating under the FXOpen brand, nor is it to be considered financial advice.
Stay ahead of the market!
Subscribe now to our mailing list and receive the latest market news and insights delivered directly to your inbox.


Latest articles

US Dollar Index (DXY): Outlook for 2025–2026
The year 2025 delivered significant volatility spikes for the US Dollar Index (DXY).
A prime example is the April shock linked to the so-called “Liberation Day tariffs”, which marked the most powerful blow to the US dollar on an annual

Tesla (TSLA) Shares Fail to Hold at an All-Time High
Yesterday, Tesla (TSLA) shares declined by more than 3%, with the following developments observed:
→ the session opened with a bearish gap;
→ the price fell nearly 8% from the all-time high recorded on 22 December;
→ the psychological $500 level has yet

The US Dollar Consolidates in a Thin Market
The US dollar has entered a consolidation phase following last week’s sharp decline. The pace of dollar weakness has slowed noticeably, while trading activity remains subdued amid the holiday period and limited market participation. Against the backdrop of low