


FXOpen

On March 18, we wrote that bears became more active near the $70,000 level.
As the BTC/USD chart shows, today the price of Bitcoin is already close to the psychological level of USD 60k, while the price of Ethereum is close to USD 3,000.
According to MarketWatch, experts consider the decline to be a correction that is “long overdue” as part of an upward trend. According to Fundstrat, Monday saw net outflows from BTC ETFs for the first time since March 1, amounting to about $154.3 million.
What's next?
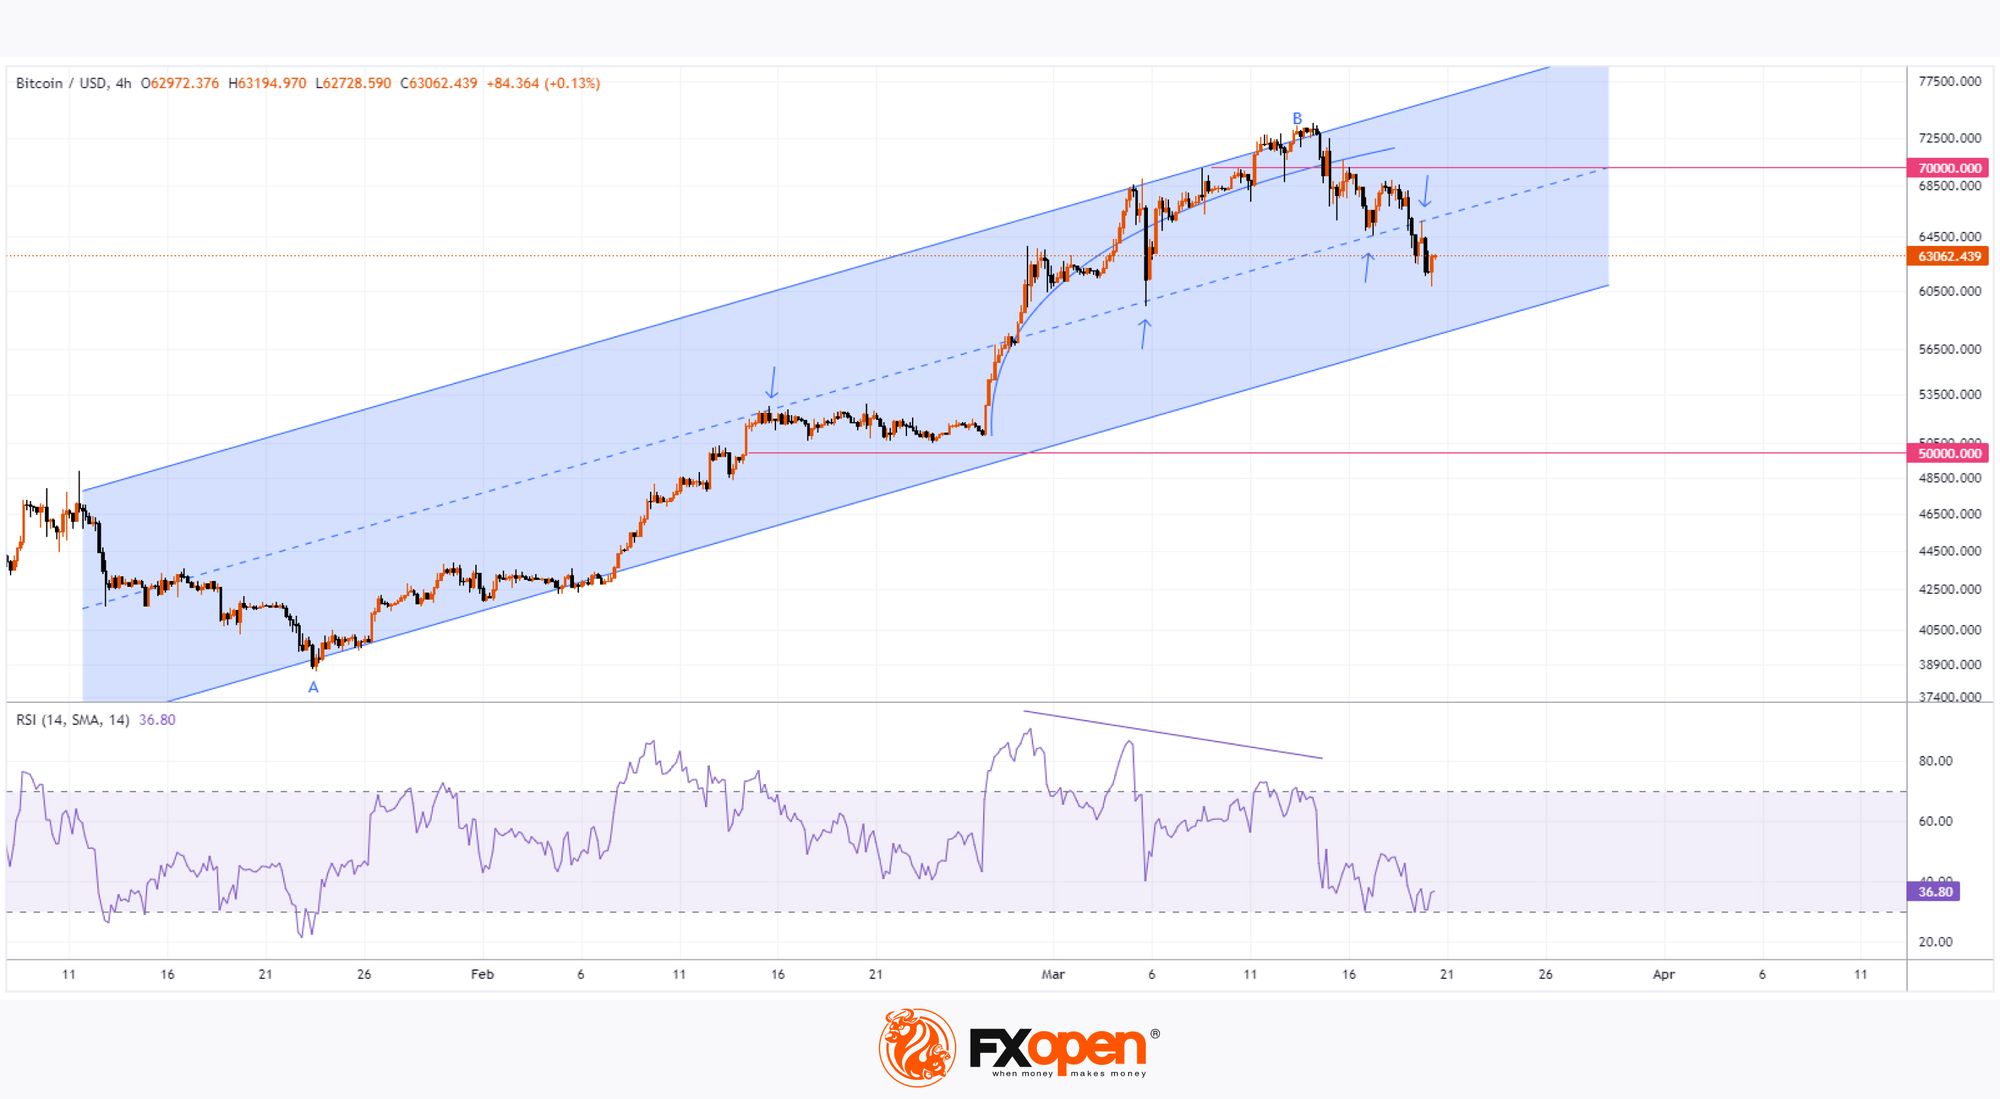
From a technical analysis point of view, the price of Bitcoin, given an increase of approximately 90% from point A (around USD 38.8k) to point B (around USD 73.4k), a normal correction of 50% indicates the prospect of a decline to the area of USD 56.1k.
Having constructed a channel (shown in blue), taking into account extrema A and B, as well as turning points (indicated by arrows), it is permissible to assume that the price of Bitcoin will drop to the lower boundary of the channel in the area of $57k, where it currently lies.
Thus, the USD 56-57k area can be seen as a target for the bears, who have seized the initiative after the upward momentum has exhausted itself (judging by the divergence on the RSI indicator).
In the event of a deeper correction, a test of the psychological mark of USD 50k per Bitcoin cannot be ruled out.
However, despite the significant decline (about 15% over the last 6 days), the Bitcoin market can be considered bullish:
→ the blue ascending channel has not yet been broken;
→ the approaching halving is seen as a growth driver;
→ according to the new Bitcoin price forecast from Standard Chartered, the target has been increased to USD 150k by the end of 2024 and USD 250k by the end of 2025.
FXOpen offers the world's most popular cryptocurrency CFDs*, including Bitcoin and Ethereum. Floating spreads, 1:2 leverage — at your service (additional fees may apply). Open your trading account now or learn more about crypto CFD trading with FXOpen.
*Important: At FXOpen UK, Cryptocurrency trading via CFDs is only available to our Professional clients. They are not available for trading by Retail clients. To find out more information about how this may affect you, please get in touch with our team.
This article represents the opinion of the Companies operating under the FXOpen brand only. It is not to be construed as an offer, solicitation, or recommendation with respect to products and services provided by the Companies operating under the FXOpen brand, nor is it to be considered financial advice.
Stay ahead of the market!
Subscribe now to our mailing list and receive the latest market news and insights delivered directly to your inbox.


Latest articles

Consolidation Ahead of NFP: Commodity Currencies Search for Direction
Commodity-linked currencies have entered a consolidation phase following recent directional moves, as market participants adopt a wait-and-see approach ahead of key US labour market data. Current price action reflects a balance between ongoing demand for the US dollar and attempts

The Real Driver Behind the Dollar Rally: Market Insights with Gary Thomson
The US dollar has been firm, but the drivers behind the move may be more complex than they first appear.
While geopolitical tension and shifts in risk sentiment play a role, current price behaviour seems increasingly influenced by inflation expectations

EUR/USD and USD/CHF Pull Back: Market Reacts to Fundamentals
European currencies have shown a recovery in recent trading sessions after their recent decline, displaying early signs of a reversal. The US dollar is weakening amid expectations surrounding upcoming US macroeconomic data, while market participants are reassessing their short-term positions