


FXOpen

On 24 October, we noted that the DAX 40 stock index (Germany 40 mini on FXOpen) was losing bullish momentum and could break downward from the Bearish Rising Wedge pattern (marked with black lines).
Since then, as indicated by the orange arrow on the DAX 40 chart:
→ The price dropped below the pattern.
→ It found support at the psychological level of 19,000, which had previously acted as resistance (marked by arrows).
→ The price then rose to a historic high, breaking the 20,000 level.
Interestingly, the index has risen despite media reports stating:
→ The IFO Business Climate Index has fallen for the fifth consecutive month.
→ The German Services PMI has remained below 50.0. New data released today confirms that economic weakness is spreading beyond the manufacturing sector.
The bullish sentiment may be driven by the weakening euro, which makes German export-oriented companies more attractive to investors.
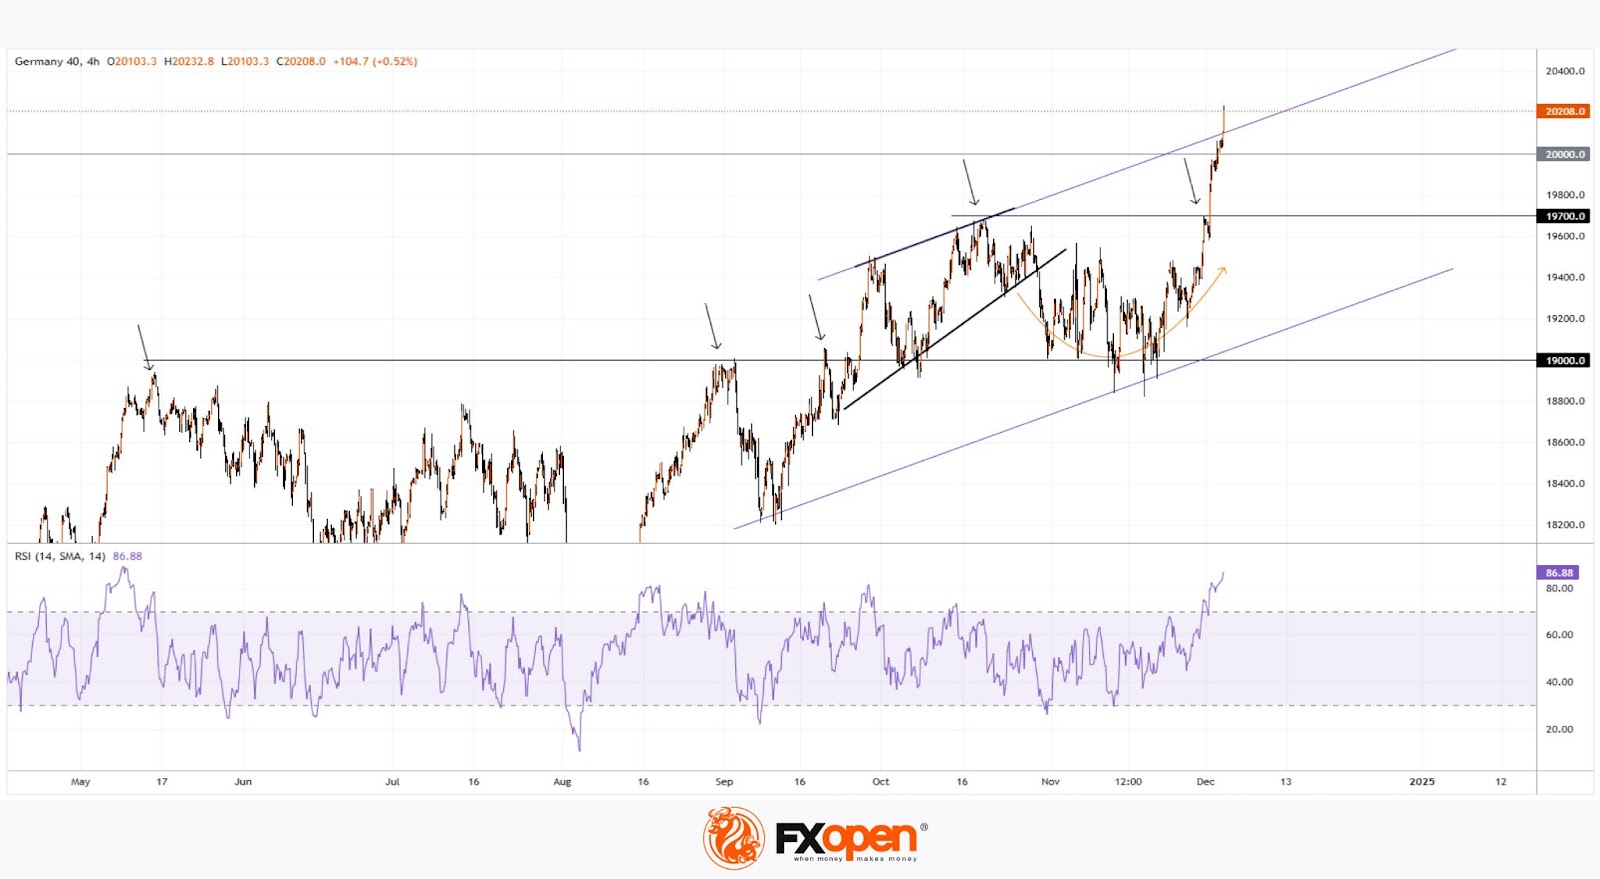
Today, the chart of the German stock index DAX 40 (Germany 40 mini on FXOpen) indicates that the stock market may be overbought:
→ The RSI indicator is at its highest level since May.
→ The price is near the upper boundary of the channel (marked with purple lines), constructed from key reversal points in autumn 2024.
Given these factors, it seems plausible that a correction could be forming under the current conditions. After the rally that started in late November, the DAX 40 index (Germany 40 mini on FXOpen) may decline towards the former resistance level of 19,700.
Trade global index CFDs with zero commission and tight spreads (additional fees may apply). Open your FXOpen account now or learn more about trading index CFDs with FXOpen.
This article represents the opinion of the Companies operating under the FXOpen brand only. It is not to be construed as an offer, solicitation, or recommendation with respect to products and services provided by the Companies operating under the FXOpen brand, nor is it to be considered financial advice.
Stay ahead of the market!
Subscribe now to our mailing list and receive the latest market news and insights delivered directly to your inbox.


Latest articles

Gold Price Holds Near Key Support
As the XAU/USD chart shows, the gold price has been holding within the $5,060–$5,200 range over the past several sessions.
Bullish view: the key support is the lower boundary of the long-term channel that has been

EUR/USD Chart Analysis: Pair Rebounds from the Year’s Low
Analysing the EUR/USD chart five days ago, we:
→ constructed a downward channel, noting signs that the bears remained in control;
→ outlined a scenario in which the rate would decline to a new yearly low (and test the lower boundary

Dollar Index (DXY) Hits Yearly High
Today, the dollar index rose above last week’s peak around the 99.68 level, setting a new high for 2026. This movement is supported by a tense fundamental backdrop:
→ Inflationary pressures from rising oil prices. Markets may be pricing