


E-mini S&P 500: What the Decline in Volatility Means
FXOpen

The daily E-mini S&P 500 chart shows that the ATR indicator (14) is in the 2023 lows, dropping below the value of 40.
What can low values of the ATR indicator mean, indicating a decrease in volatility?
1→ Remember the proverb “Sell in May and Go Away”, implying that the stock market is usually inactive starting from May. Are traders already on vacation after the main part of the reporting season? It is unlikely that the solution to the problem with the US public debt lies ahead. Already today, Tuesday, President Biden held talks with representatives of Congress on this matter.
2→ An important trend is brewing in the E-mini S&P 500 futures market. Notice the low ATR values at the end of 2021, followed by a massive decline. The market periodically changes its state: from flat (when reversal strategies work) → to trend (when breakout strategies work) → and so on ad infinitum.
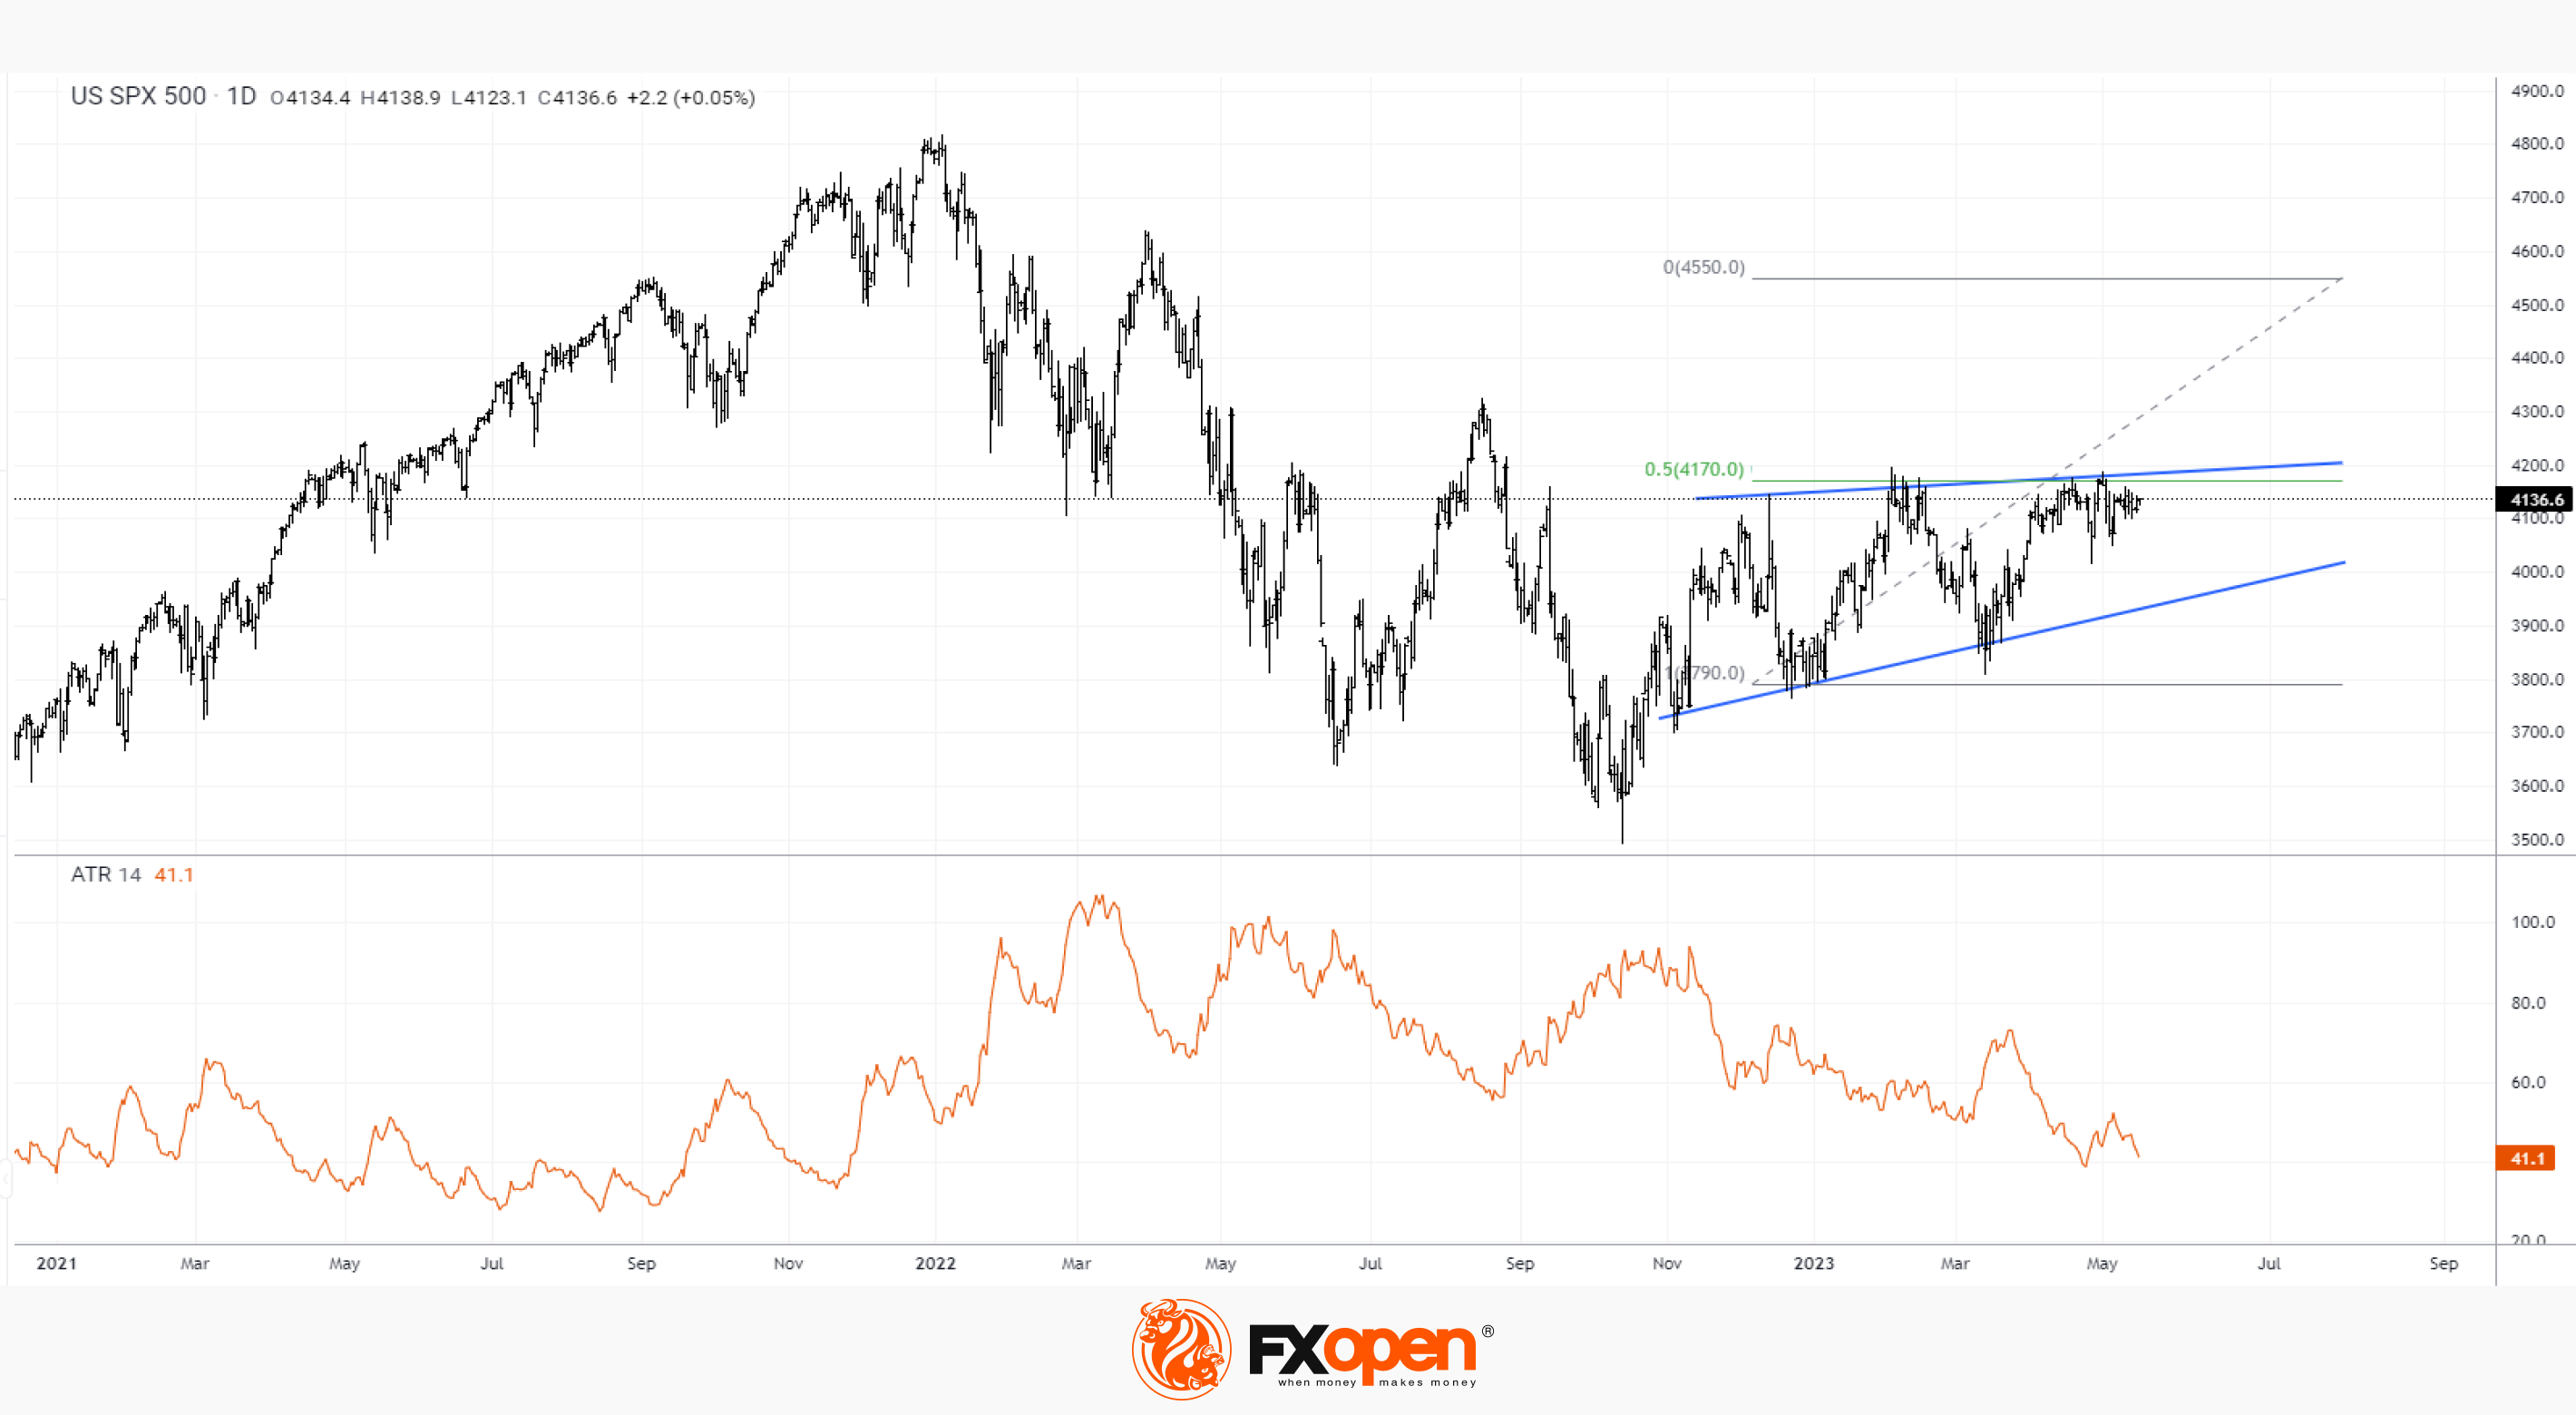
Decreasing volatility forms a narrowing triangle (shown in blue lines). Its breakdown may lead to a trend that will change the price of the E-mini S&P 500 futures to a value approximately equal to the height of this triangle. Let's say in the event of a bullish breakout, the E-mini S&P 500 could rise to 4,550.
This article represents the opinion of the Companies operating under the FXOpen brand only. It is not to be construed as an offer, solicitation, or recommendation with respect to products and services provided by the Companies operating under the FXOpen brand, nor is it to be considered financial advice.
Trade global index CFDs with zero commission and tight spreads (additional fees may apply). Open your FXOpen account now or learn more about trading index CFDs with FXOpen.
This article represents the opinion of the Companies operating under the FXOpen brand only. It is not to be construed as an offer, solicitation, or recommendation with respect to products and services provided by the Companies operating under the FXOpen brand, nor is it to be considered financial advice.
Stay ahead of the market!
Subscribe now to our mailing list and receive the latest market news and insights delivered directly to your inbox.


Latest articles

AUD/CAD: Months of Indecision — Is a Breakout Finally Coming?
The Australian dollar has clawed back most of its end-of-June losses, when it touched three-month lows against the greenback amid escalating Middle East tensions. Since then, sentiment has improved: the RBA's Assistant Governor Sarah Hunter signalled the board stands ready

USD/JPY: Battling at the Top of the Triangle
On 3 July, Japan's Finance Minister, Satsuki Katayama, stated that the Ministry of Finance remains in close contact with US authorities regarding developments in USD/JPY as the yen traded near its weakest level in almost 40 years. Similar verbal

Dow Jones (DJIA): Consolidation Beyond the Trend
Federal Reserve Chair Kevin Warsh testified before Congress on 14–15 July, reaffirming the Fed's commitment to bringing inflation back to target while providing no clear guidance on the future path of interest rates. Meanwhile, June inflation data came in