


Earnings Season Kicks Off with Strong Bank Results
FXOpen

On 3 October, we noted growing optimism in equity markets ahead of the corporate earnings season. That sentiment was validated yesterday as several major banks reported results that exceeded analysts’ expectations, helping the S&P 500 index (US SPX 500 mini on FXOpen) rebound from last Friday’s sell-off.
Morgan Stanley (MS) led the rally, with its shares hitting a new all-time high above $166 following a robust quarterly report:
→ Revenue surged to a record $18.2 billion, up 18% year-on-year.
→ Earnings per share (EPS): actual $2.80, vs forecast $2.10.
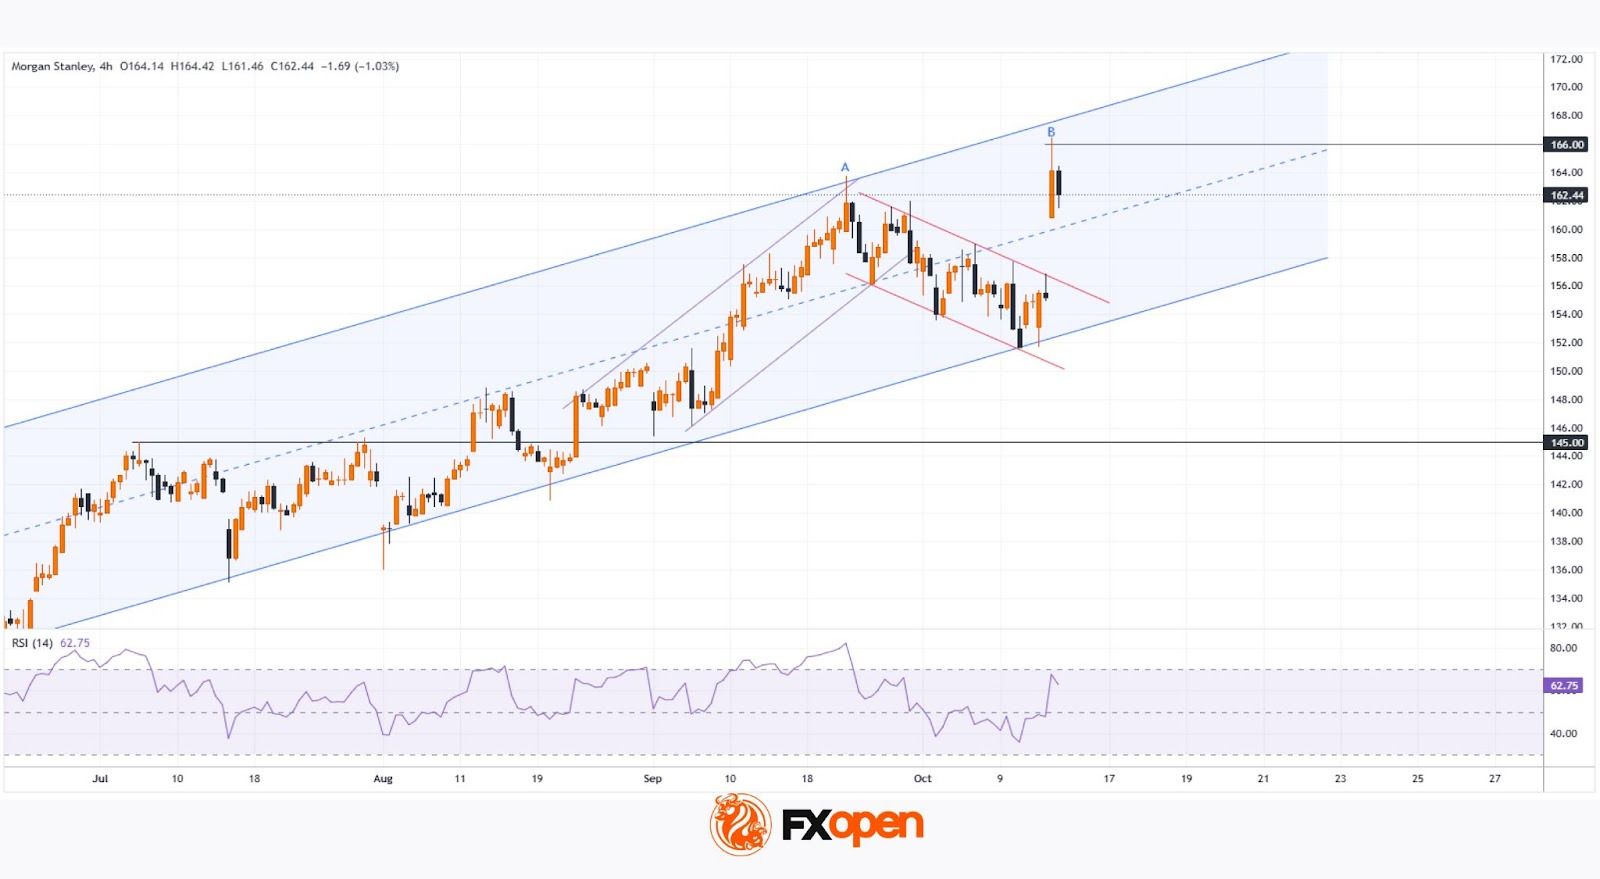
Technical Analysis of Morgan Stanley (MS)
Price action in MS shares allows for the construction of an upward channel (shown in blue) that has been forming since the summer.
→ Yesterday, a wide bullish gap appeared on the chart.
→ The price advanced into the upper half of the channel, breaking above the $160 psychological level.
From a bullish perspective:
→ The breakout from a bullish flag pattern supports the scenario of a resumed uptrend within the channel.
→ The channel median, reinforced by the $160 support, could serve as a key level going forward.
However, there are several bearish signals to note:
→ Intraday price swings formed a wide up-and-down movement, resembling a bearish engulfing pattern that could develop further in today’s session.
→ The brief and shallow breakout above the previous high suggests a bull trap.
The RSI indicator also shows signs of bearish divergence, implying that:
→ The recent surge in MS shares may have prompted some long holders to lock in profits near record highs.
→ Despite strong fundamentals supporting long-term growth, the stock could be vulnerable to a short-term correction, potentially towards the bullish gap area.
Buy and sell stocks of the world's biggest publicly-listed companies with CFDs on FXOpen’s trading platform. Open your FXOpen account now or learn more about trading share CFDs with FXOpen.
This article represents the opinion of the Companies operating under the FXOpen brand only. It is not to be construed as an offer, solicitation, or recommendation with respect to products and services provided by the Companies operating under the FXOpen brand, nor is it to be considered financial advice.
Stay ahead of the market!
Subscribe now to our mailing list and receive the latest market news and insights delivered directly to your inbox.


Latest articles

Weekly Market Insights with Gary Thomson: The Week of Central Banks and Earnings
In this video, we’ll explore the key economic events and market trends, shaping the financial landscape. Get ready for insights into financial markets to help you navigate the week ahead. Let’s dive in!
In this episode of Market

Intel at a Crossroads: Earnings Beat Meets Technical Resistance
Intel has just delivered its strongest quarter in over fifteen years, and the market reaction says it all. Q2 2026 revenue surged 25% year-over-year to $16.1 billion, crushing the consensus estimate of $14.42 billion, while adjusted EPS of

Tesla: Complex Range Structure Breaks Down Following Quarterly Earnings
Tesla released its Q2 2026 results after the market closed on 22 July. Revenue increased 26% year-on-year to $28.24 billion, while vehicle deliveries reached a record 480,126 units. However, operating margin fell sharply to 1.4%, down from