


FXOpen

The price action of Eli Lilly and Company (LLY), the world’s largest pharmaceutical firm, reflects exceptionally strong demand:
→ since the start of the month, LLY shares have risen by roughly 30%;
→ in late November, the company’s market capitalisation exceeded $1 trillion, making Eli Lilly the first pharmaceutical firm in history to reach this level.
Why are Eli Lilly (LLY) Shares Rising?
A key driver has been the strong earnings report published on 30 October.
→ Earnings per share came in far above expectations ($7.02 versus $5.69).
→ Sales of diabetes treatment Mounjaro and obesity drug Zepbound surpassed $10 billion for the quarter.
→ On the back of this success, management raised its revenue outlook, and market participants now expect an even stronger fourth quarter.
At the same time, the chart is signalling that the extraordinary rally may be running out of steam.
Technical Analysis of Eli Lilly (LLY) Shares
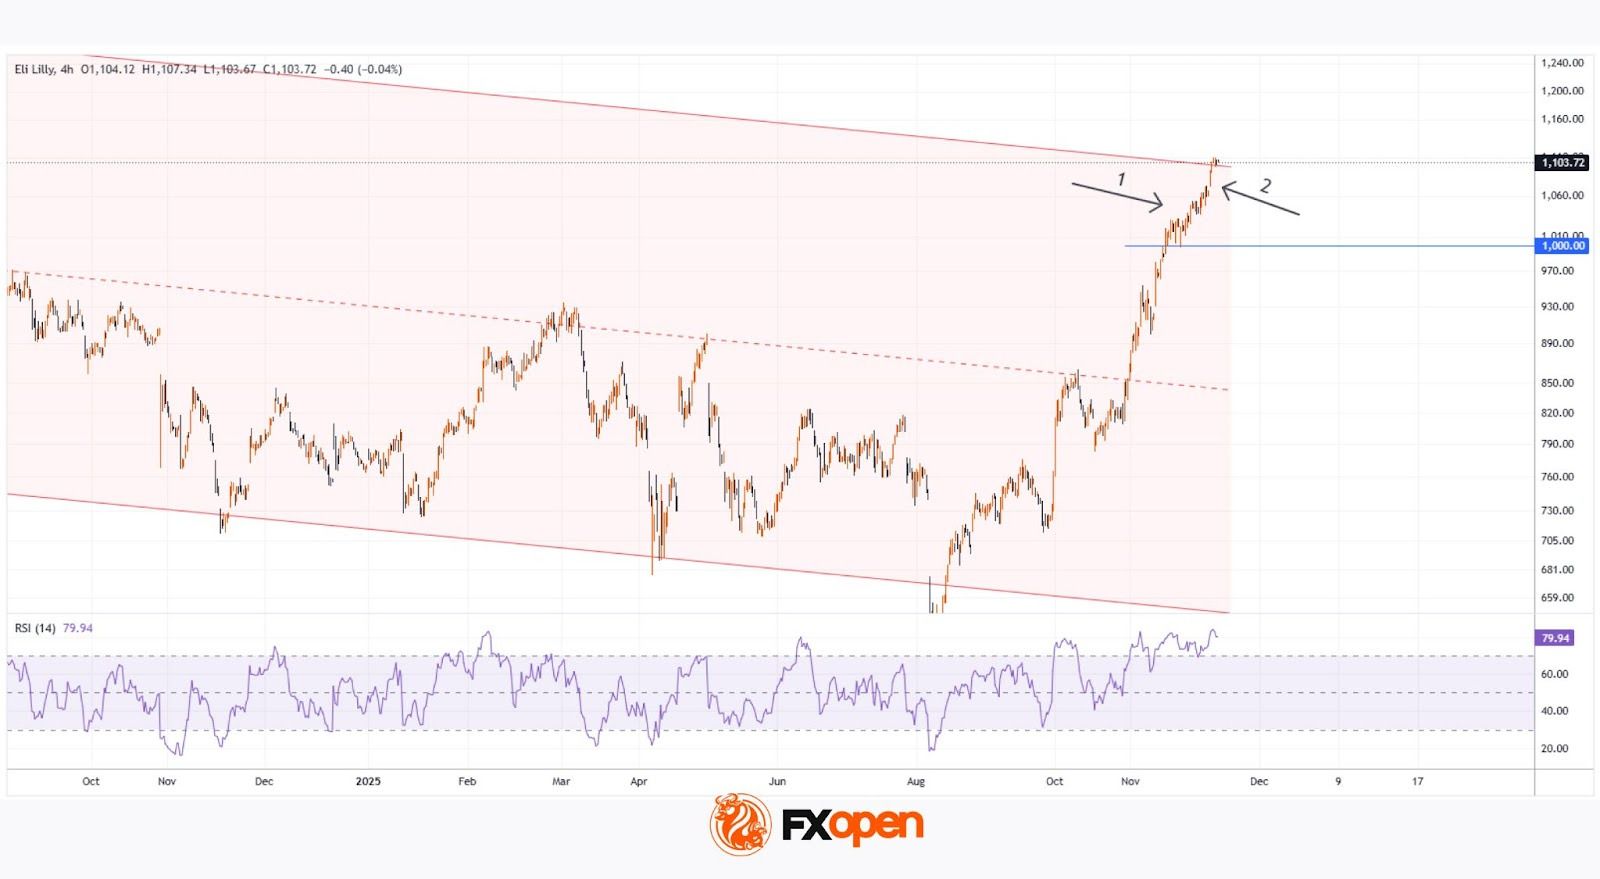
For more than a year, LLY’s price action followed a downward channel. If this channel is extended upward twofold after the bullish breakout (which occurred following the earnings release), we can see that the price has reached the upper boundary of the expanded channel — a level often viewed as a potential target for buyers.
Note that after breaking above the psychological $1,000 level, the rally initially slowed (1), but then accelerated sharply this week (2) — a possible sign of FOMO and the climax of the November uptrend.
Additionally → the RSI indicator is deep in overbought territory and is pointing lower.
Given these factors, it is reasonable to assume that LLY shares are vulnerable to a pullback, which could intensify if investors begin taking profits on long positions.
Buy and sell stocks of the world's biggest publicly-listed companies with CFDs on FXOpen’s trading platform. Open your FXOpen account now or learn more about trading share CFDs with FXOpen.
This article represents the opinion of the Companies operating under the FXOpen brand only. It is not to be construed as an offer, solicitation, or recommendation with respect to products and services provided by the Companies operating under the FXOpen brand, nor is it to be considered financial advice.
Stay ahead of the market!
Subscribe now to our mailing list and receive the latest market news and insights delivered directly to your inbox.


Latest articles

Market Analysis: Gold Price Slips Back, WTI Crude Oil Rally Gains Fresh Strength
Gold price rallied above $4,750 before correcting lower. Crude oil prices are rising and could climb further higher toward $110.00.
Important Takeaways for Gold and WTI Crude Oil Prices Analysis Today
· Gold price gained pace for a move

Consolidation Ahead of NFP: Commodity Currencies Search for Direction
Commodity-linked currencies have entered a consolidation phase following recent directional moves, as market participants adopt a wait-and-see approach ahead of key US labour market data. Current price action reflects a balance between ongoing demand for the US dollar and attempts

The Real Driver Behind the Dollar Rally: Market Insights with Gary Thomson
The US dollar has been firm, but the drivers behind the move may be more complex than they first appear.
While geopolitical tension and shifts in risk sentiment play a role, current price behaviour seems increasingly influenced by inflation expectations