


Elon Musk Contributes to NVDA Price Surge to a New Record
FXOpen

Yesterday, on Tuesday, Nvidia's stock price reached a historic high, surpassing the $1,130 mark, increasing by almost 7% relative to Monday's closing price. This happened after a turbulent past week, during which Nvidia published a very strong report that led to an over 8% rise in its stock price in one day.
Thus, since the beginning of May, NVDA's price has increased by approximately 34%. The latest surge in bullish sentiment was driven by the news that Elon Musk's company xAI is purchasing Nvidia AI chips for a new powerful supercomputer.
Investor’s Business Daily reports that in a presentation for investors, Musk stated that:
→ xAI will require up to 100,000 specialised semiconductors for training and launching the next version of its AI chatbot, Grok.
→ The supercomputer will use Nvidia H100 graphics processors.
→ Musk hopes to bring the supercomputer, which he referred to as a “gigafactory of computation,” online by autumn 2025.
Analysing NVDA's stock price last week, we:
→ Updated the upward channel;
→ Suggested that on a bullish impulse, NVDA’s price could approach the median line of the upward channel.
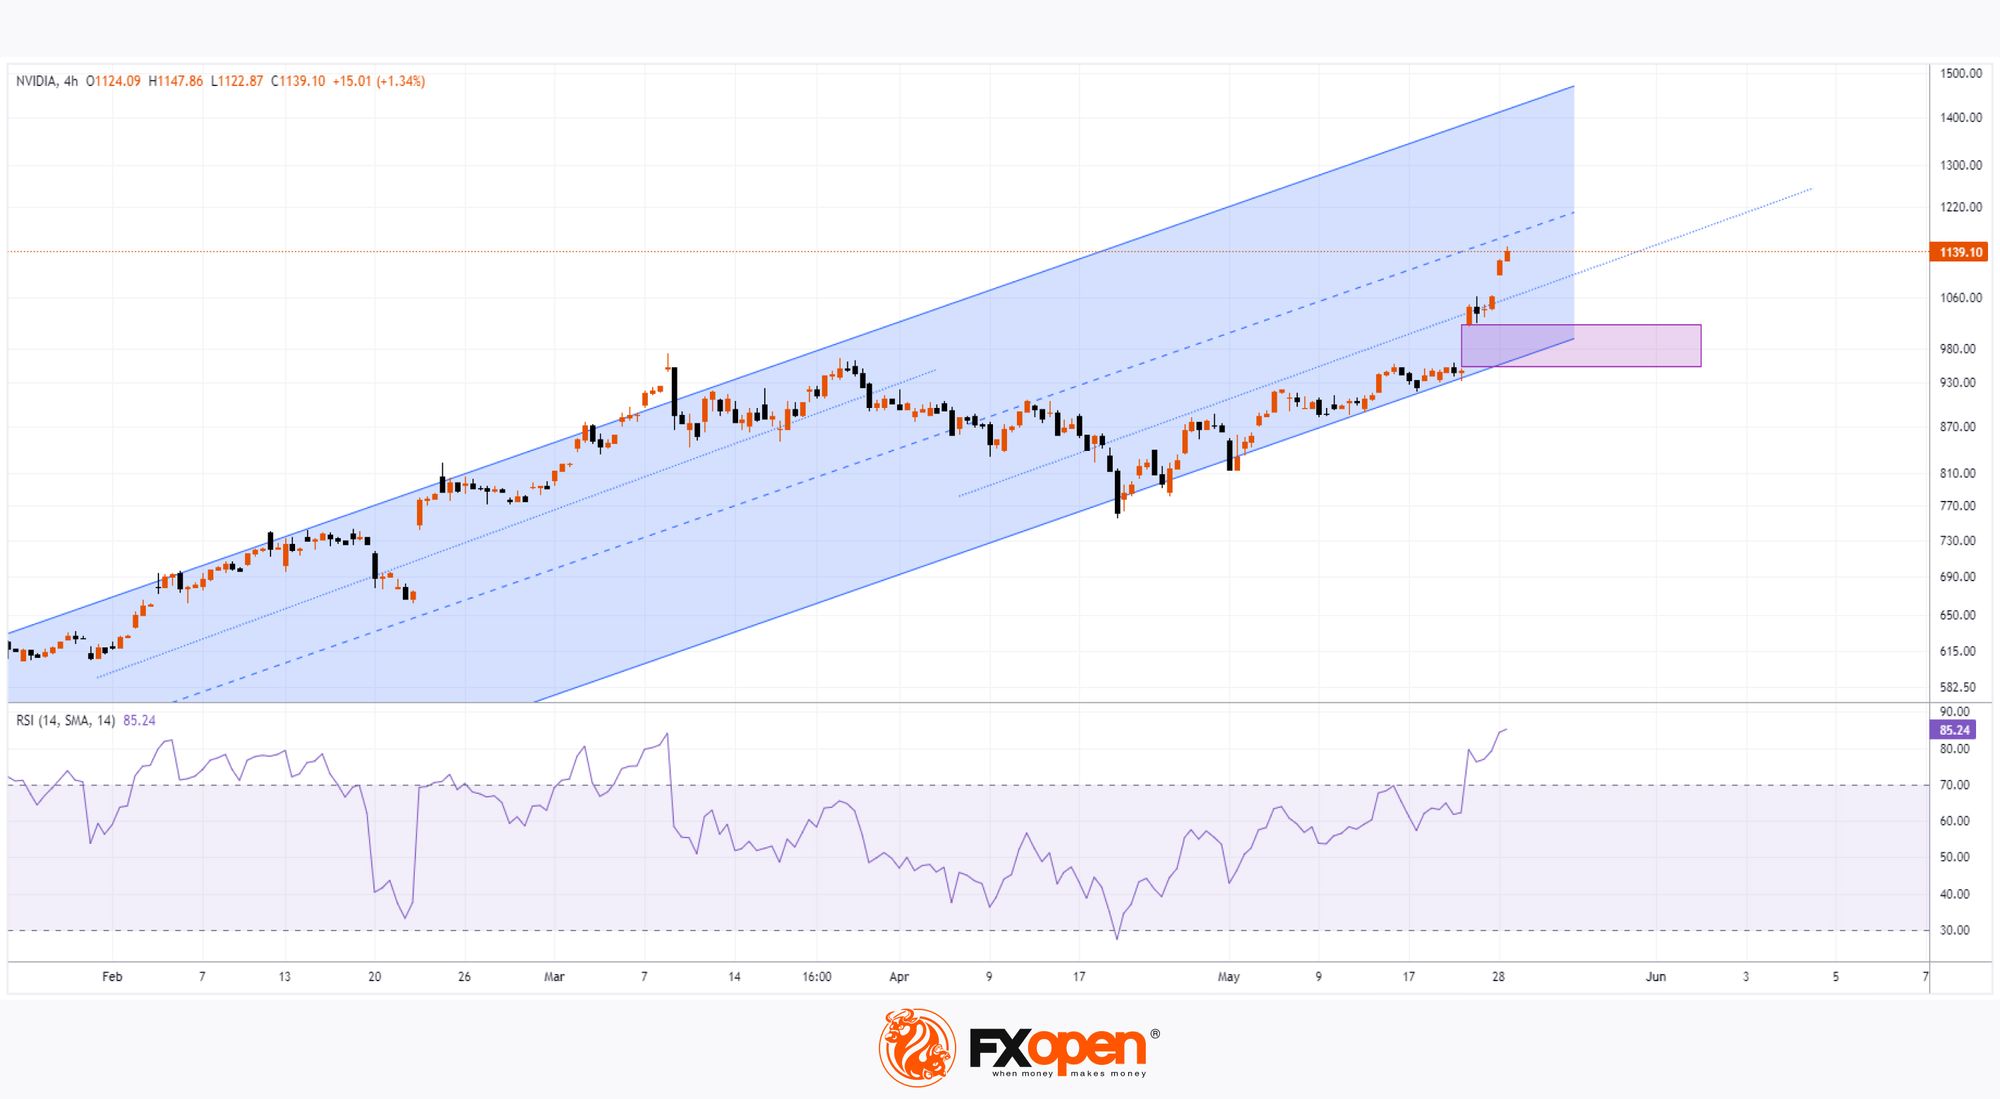
Technical analysis of the 4-hour NVDA stock chart today shows that:
→ The price is in the median line zone (which may act as resistance);
→ RSI is at its highest in a year.
Considering these factors, it is reasonable to assume that the market is excessively overbought and vulnerable to a pullback. A 1:10 stock split scheduled for 10 June could play a role. While Nvidia shares will become more accessible to a broader range of investors (a bullish sign), it is possible that the "buy the rumour, sell the news" principle may apply, and after a series of positive events for NVDA stock, its price may correct towards the lower boundary of the 2024 upward channel and possibly test the gap area (shown in purple).
Buy and sell stocks of the world's biggest publicly-listed companies with CFDs on FXOpen’s trading platform. Open your FXOpen account now or learn more about trading share CFDs with FXOpen.
This article represents the opinion of the Companies operating under the FXOpen brand only. It is not to be construed as an offer, solicitation, or recommendation with respect to products and services provided by the Companies operating under the FXOpen brand, nor is it to be considered financial advice.
Stay ahead of the market!
Subscribe now to our mailing list and receive the latest market news and insights delivered directly to your inbox.


Latest articles

AI Valuations Are Back in the Spotlight
Artificial intelligence remains the dominant investment theme of 2026, but investors are increasingly questioning whether AI stock valuations are keeping pace with reality.
💰 Big Tech continues to invest at an unprecedented scale, with hyperscaler AI spending projected to exceed $800

AUD/CAD: Months of Indecision — Is a Breakout Finally Coming?
The Australian dollar has clawed back most of its end-of-June losses, when it touched three-month lows against the greenback amid escalating Middle East tensions. Since then, sentiment has improved: the RBA's Assistant Governor Sarah Hunter signalled the board stands ready

USD/JPY: Battling at the Top of the Triangle
On 3 July, Japan's Finance Minister, Satsuki Katayama, stated that the Ministry of Finance remains in close contact with US authorities regarding developments in USD/JPY as the yen traded near its weakest level in almost 40 years. Similar verbal