


FXOpen
According to today’s daily chart of EUR/GBP:
→ The rate is around £0.832 per euro – the lowest since April 2022.
→ The RSI indicator has dropped into oversold territory.
Yesterday, the EUR/GBP rate fell by 0.71%, driven by bearish sentiment following the release of PMI indices, which indicated a slowdown in the Eurozone economy.
According to Forex Factory:
French Flash Manufacturing PMI: actual = 44.0, expected = 44.3, previous = 43.9;
French Flash Services PMI: actual = 48.3, expected = 53.0, previous = 55.0;
German Flash Manufacturing PMI: actual = 40.3, expected = 42.4, previous = 42.4;
German Flash Services PMI: actual = 50.6, expected = 51.1, previous = 51.2.
Meanwhile, PMI indices for the UK remain above 50, signalling economic growth.
Flash Manufacturing PMI: actual = 51.5, expected = 52.3, previous = 52.5;
Flash Services PMI: actual = 52.8, expected = 53.5, previous = 53.7.
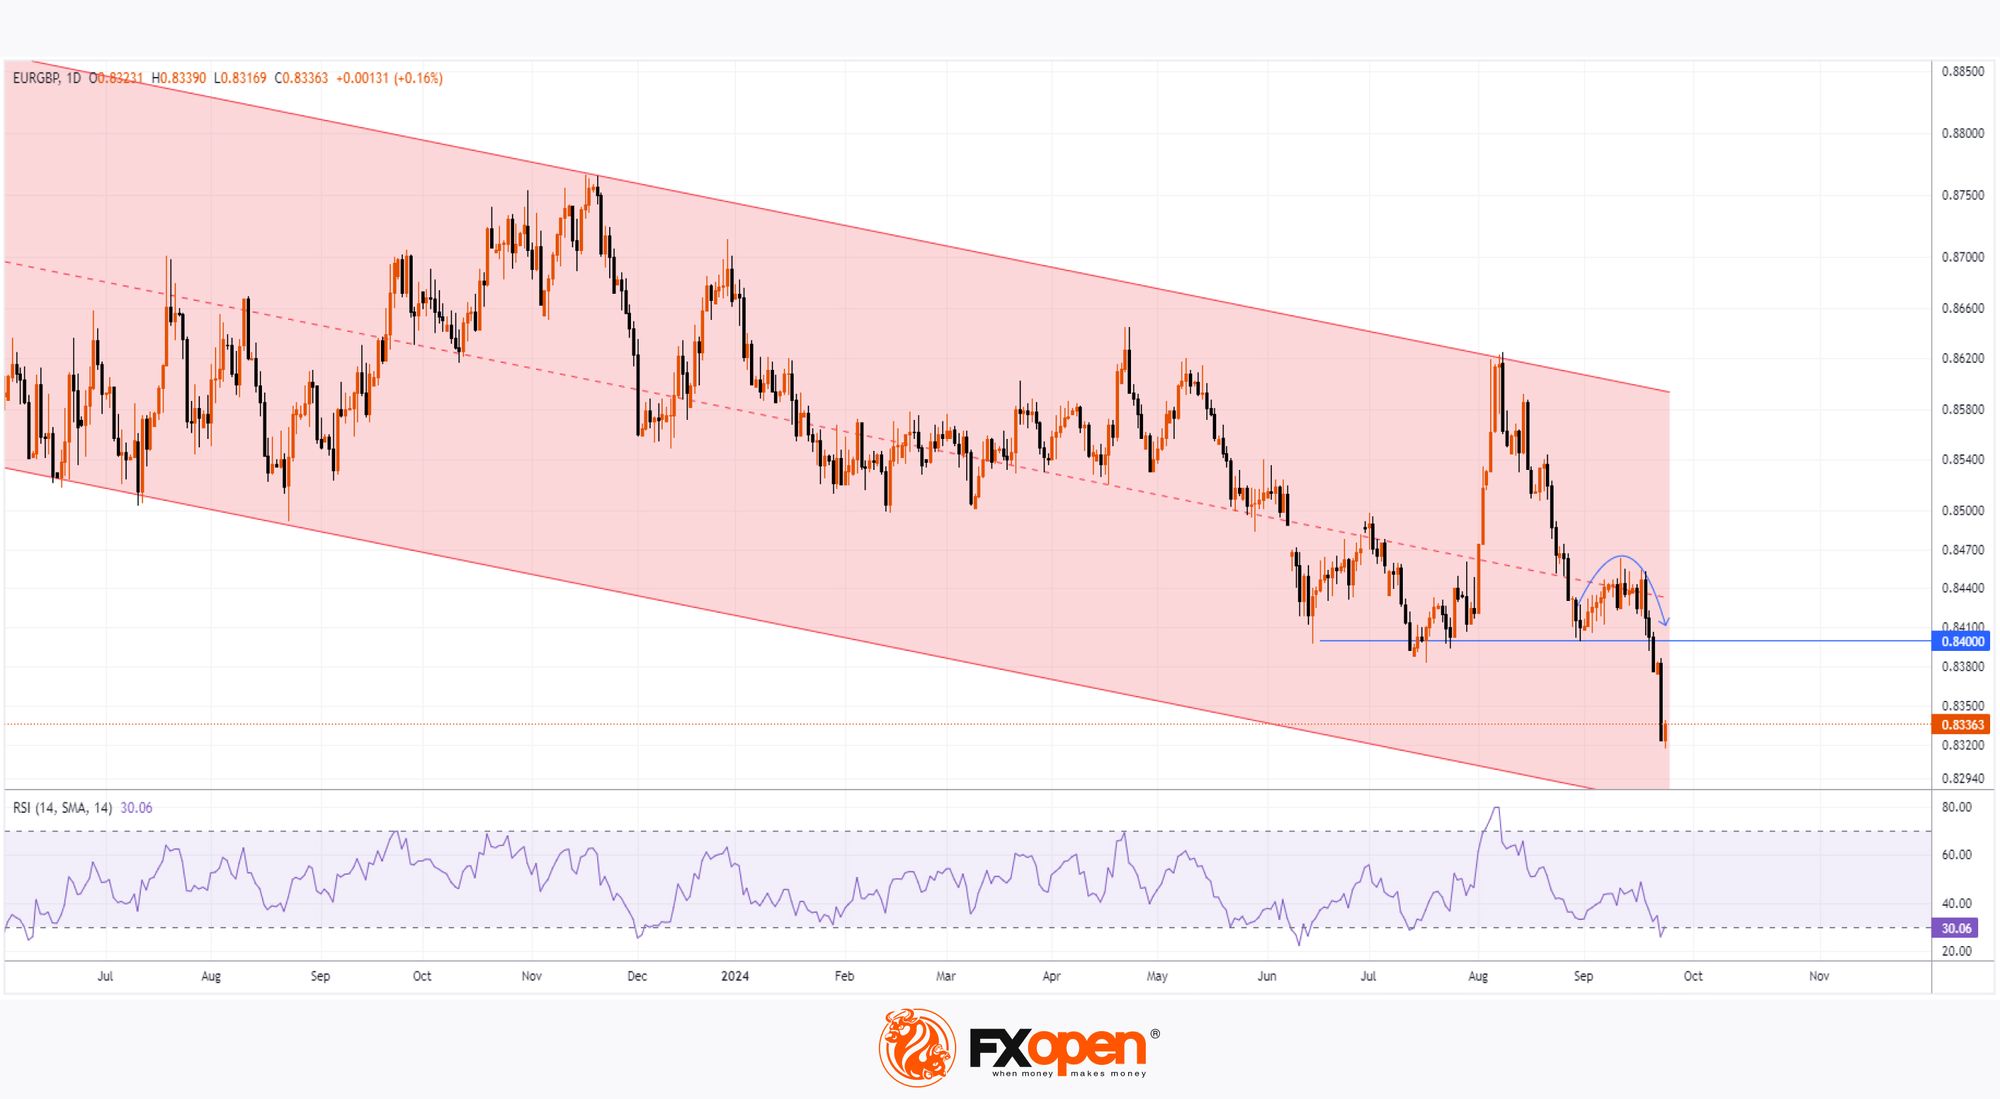
Technical analysis of the EUR/GBP chart today shows the price moving within a descending channel (marked in red).
In September, the price bounced off the £0.840 level, which had acted as support since June. The price movement formed an arc (shown by an arrow), suggesting that:
- Demand is weakening.
- The median line of the red channel is acting as resistance.
If bears maintain control of the market, the EUR/GBP rate could fall towards the lower boundary of the red channel.
However, if bulls attempt to recover, the price may face strong resistance at the £0.840 level.
Trade over 50 forex markets 24 hours a day with FXOpen. Take advantage of low commissions, deep liquidity, and spreads from 0.0 pips (additional fees may apply). Open your FXOpen account now or learn more about trading forex with FXOpen.
This article represents the opinion of the Companies operating under the FXOpen brand only. It is not to be construed as an offer, solicitation, or recommendation with respect to products and services provided by the Companies operating under the FXOpen brand, nor is it to be considered financial advice.
Stay ahead of the market!
Subscribe now to our mailing list and receive the latest market news and insights delivered directly to your inbox.


Latest articles

Market Analysis: GBP/USD Dips Further As EUR/GBP Regains Traction
GBP/USD failed to climb above 1.3500 and corrected some gains. EUR/GBP started a decent increase and might aim for more gains above 0.8700.
Important Takeaways for GBP/USD and EUR/GBP Analysis Today
· The British Pound


Market Insights with Gary Thomson: Oil, US Retail Sales & NFP in Focus
In this video, we’ll explore the key economic events and market trends, shaping the financial landscape. Get ready for insights into financial markets to help you navigate the week ahead. Let’s dive in!
In this episode of Market