


EUR/USD Chart Analysis: Volatility May Return to the Market
FXOpen

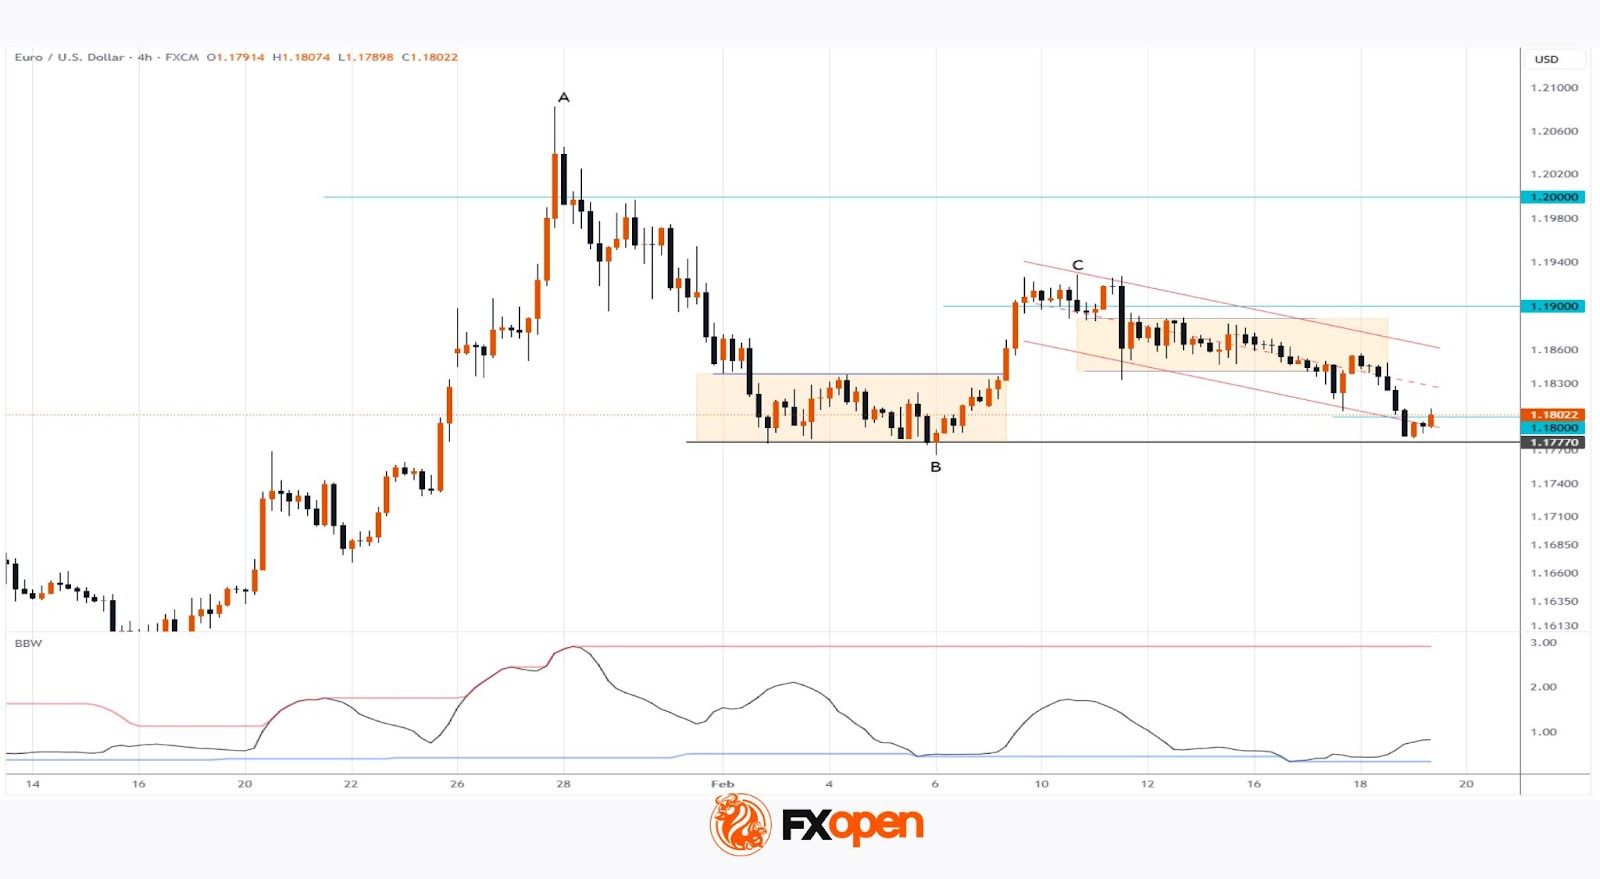
As indicated by the Bollinger Bands width indicator, the EUR/USD market remained relatively subdued in February, with the indicator twice retreating towards its lower boundary.
However, price action over the past two sessions suggests renewed activity — the range formed between 11 and 17 February has been broken to the downside by sellers.
From a fundamental perspective, this move reflects a combination of factors, including:
→ Reports that European Central Bank President Christine Lagarde is planning to step down before the end of her term in October next year. This development is viewed as a bearish factor for the euro.
→ Minutes from the FOMC meeting showing that policymakers are in no rush to cut interest rates. Opinions were divided, with some members even open to raising the Fed rate if inflation proves persistent. The prospect of a tighter Federal Reserve stance is supportive for the US dollar.
Technical Analysis of the EUR/USD Chart
The recent bearish pressure has pushed EUR/USD back towards a key support level around 1.1777. Bears attempted to break below this level on 6 February but failed, resulting in a false breakout at point B.
While bulls may attempt a rebound from this support, the broader picture suggests that sellers currently hold a slight advantage in February, reflected in the following:
→ Price action has been forming a descending channel since 11 February (shown in red).
→ High C sits roughly halfway along the A→B bearish impulse. According to Fibonacci proportions, this is consistent with a bearish market structure.
→ Bulls have been unable to secure a foothold above key psychological levels — first above 1.2000 and subsequently above 1.1900.
If selling pressure persists, a decisive break below 1.1777 cannot be ruled out, which could in turn trigger a fresh surge in volatility.
Trade over 50 forex markets 24 hours a day with FXOpen. Take advantage of low commissions, deep liquidity, and spreads from 0.0 pips (additional fees may apply). Open your FXOpen account now or learn more about trading forex with FXOpen.
This article represents the opinion of the Companies operating under the FXOpen brand only. It is not to be construed as an offer, solicitation, or recommendation with respect to products and services provided by the Companies operating under the FXOpen brand, nor is it to be considered financial advice.
Stay ahead of the market!
Subscribe now to our mailing list and receive the latest market news and insights delivered directly to your inbox.


Latest articles

EUR/USD: All Eyes on the Fed as the Range Reaches Its Breaking Point
The dollar's next move hinges on tonight's Fed decision, and this time markets genuinely don't know what to expect. While economists still lean toward a hold—with CME FedWatch odds sitting near 68.5% for no change—Kevin Warsh's hawkish

USD/JPY and USD/CAD Test Resistance Ahead of Fresh Fed Signals
The US dollar continues to hold the upper hand against most major currencies ahead of the outcome of the latest Federal Reserve meeting. While the base-case scenario remains for interest rates to stay unchanged, markets are also pricing in the

Amazon Earnings: Does the Chart Already Know Something the Numbers Don't?
All eyes are on July 30, when Amazon reports Q2 2026 earnings, with Wall Street increasingly convinced the bar has been set too low. Consensus sees EPS near $1.82-$2.26 on roughly $197 billion in revenue, but the