


EUR/USD Hits Key Resistance Level
FXOpen

Although financial markets in both the US and the UK are closed for a public holiday today, Donald Trump is keeping traders on their toes. According to a fresh Reuters report, the US President has backed down from his threat to impose 50% tariffs on EU goods from 1 June, following a phone call from European Commission President Ursula von der Leyen, who urged him to allow time to “reach a mutually beneficial deal”.
This development has boosted the euro while weighing on the US dollar.
As today's EUR/USD chart shows, the euro has risen to its highest level against the dollar since early May. But can the upward trend continue?
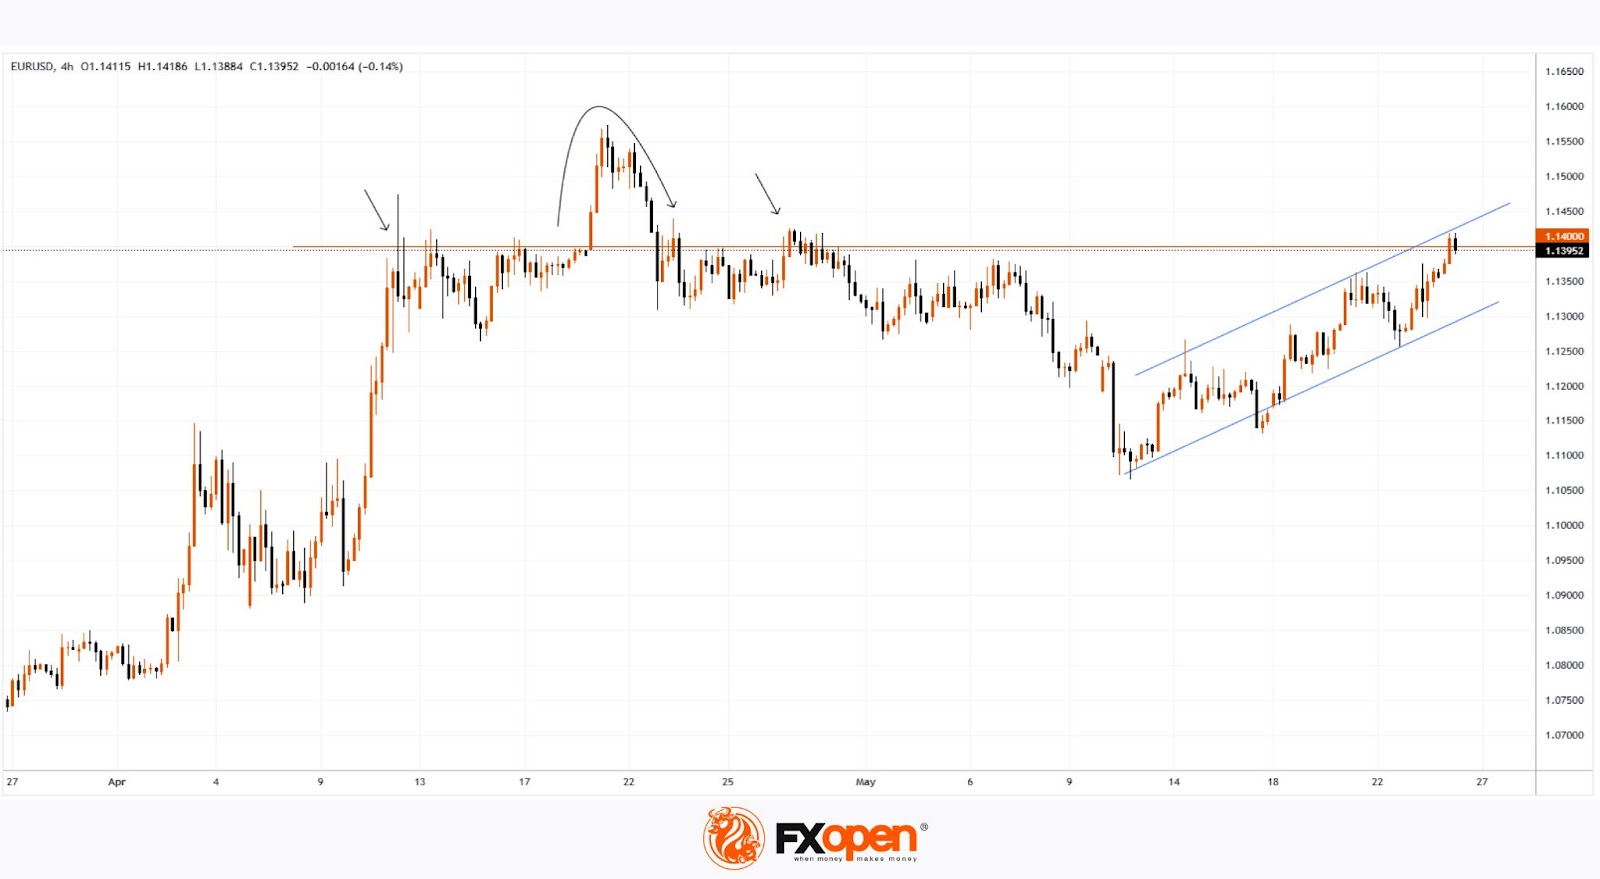
EUR/USD Technical Analysis
The ascending trend channel (highlighted in blue) confirms that bullish sentiment currently dominates. However, the EUR/USD chart also presents two bearish arguments worth noting:
→ The price has reached the upper boundary of the channel, which may act as resistance.
→ The 1.1400 level could also serve as resistance. Note how aggressively bears resisted upward movement in April: even when it appeared that the level had been clearly broken from below, the price failed to hold above it for long.
Given this, it is reasonable to suggest that EUR/USD bears may once again become active — particularly if the fundamental backdrop supports them.
Trade over 50 forex markets 24 hours a day with FXOpen. Take advantage of low commissions, deep liquidity, and spreads from 0.0 pips (additional fees may apply). Open your FXOpen account now or learn more about trading forex with FXOpen.
This article represents the opinion of the Companies operating under the FXOpen brand only. It is not to be construed as an offer, solicitation, or recommendation with respect to products and services provided by the Companies operating under the FXOpen brand, nor is it to be considered financial advice.
Stay ahead of the market!
Subscribe now to our mailing list and receive the latest market news and insights delivered directly to your inbox.


Latest articles

Nasdaq 100: 48 Hours of Chaos, One Trendline Standing in the Way
Wall Street just lived through one of its wildest 48 hours of the year. On Wednesday, the Fed held rates steady at 3.50%-3.75%, but three FOMC members broke ranks to demand a hike—an unusually hawkish dissent

Amazon Analysis: Strong Earnings Coincide with a Breakout from the Correction
On 30 July, Amazon.com reported its financial results for the second quarter of 2026, significantly exceeding market expectations. Revenue rose 20% year-on-year to $200.6 billion, compared with the consensus forecast of around $196.5 billion. The main growth

GBP/USD and EUR/GBP Await Key Bank of England Decision
The pound strengthened following the outcome of the US Federal Reserve meeting, where the central bank, as expected, kept interest rates unchanged. However, the Fed did not provide the market with clear signals of an imminent shift towards rate cuts,