


FXOpen

Last night, the FOMC meeting minutes were released. According to USNews, there were no major surprises. However, the confirmation of persistent inflation – along with hints that some officials discussed potential future rate hikes – displayed a "hawkish" stance. The dollar index initially rose following the minutes' release but returned to pre-release levels this morning, suggesting the initial reaction might have been incorrect.
Subsequently, the Purchasing Managers' Index (PMI) data for key European economies was published. According to ForexFactory:
→ Flash Manufacturing PMI (France): actual = 46.7; expected = 45.8; previous = 45.3;
→ Flash Services PMI (France): actual = 49.4; expected = 51.8; previous = 51.3;
→ Flash Manufacturing PMI (Germany): actual = 45.4; expected = 43.4; previous = 42.5;
→ Flash Services PMI (Germany): actual = 53.9; expected = 53.5; previous = 53.2.
Overall, the actual PMI figures, considered a leading indicator of economic health, exceeded expectations and gave the euro a bullish push.
The combined effect of the euro's rise and the dollar's decline since midnight resulted in a four-hour EUR/USD chart candle with a long lower tail (indicated by an arrow), suggesting demand outweighs supply. A subsequent bullish candle could confirm this.
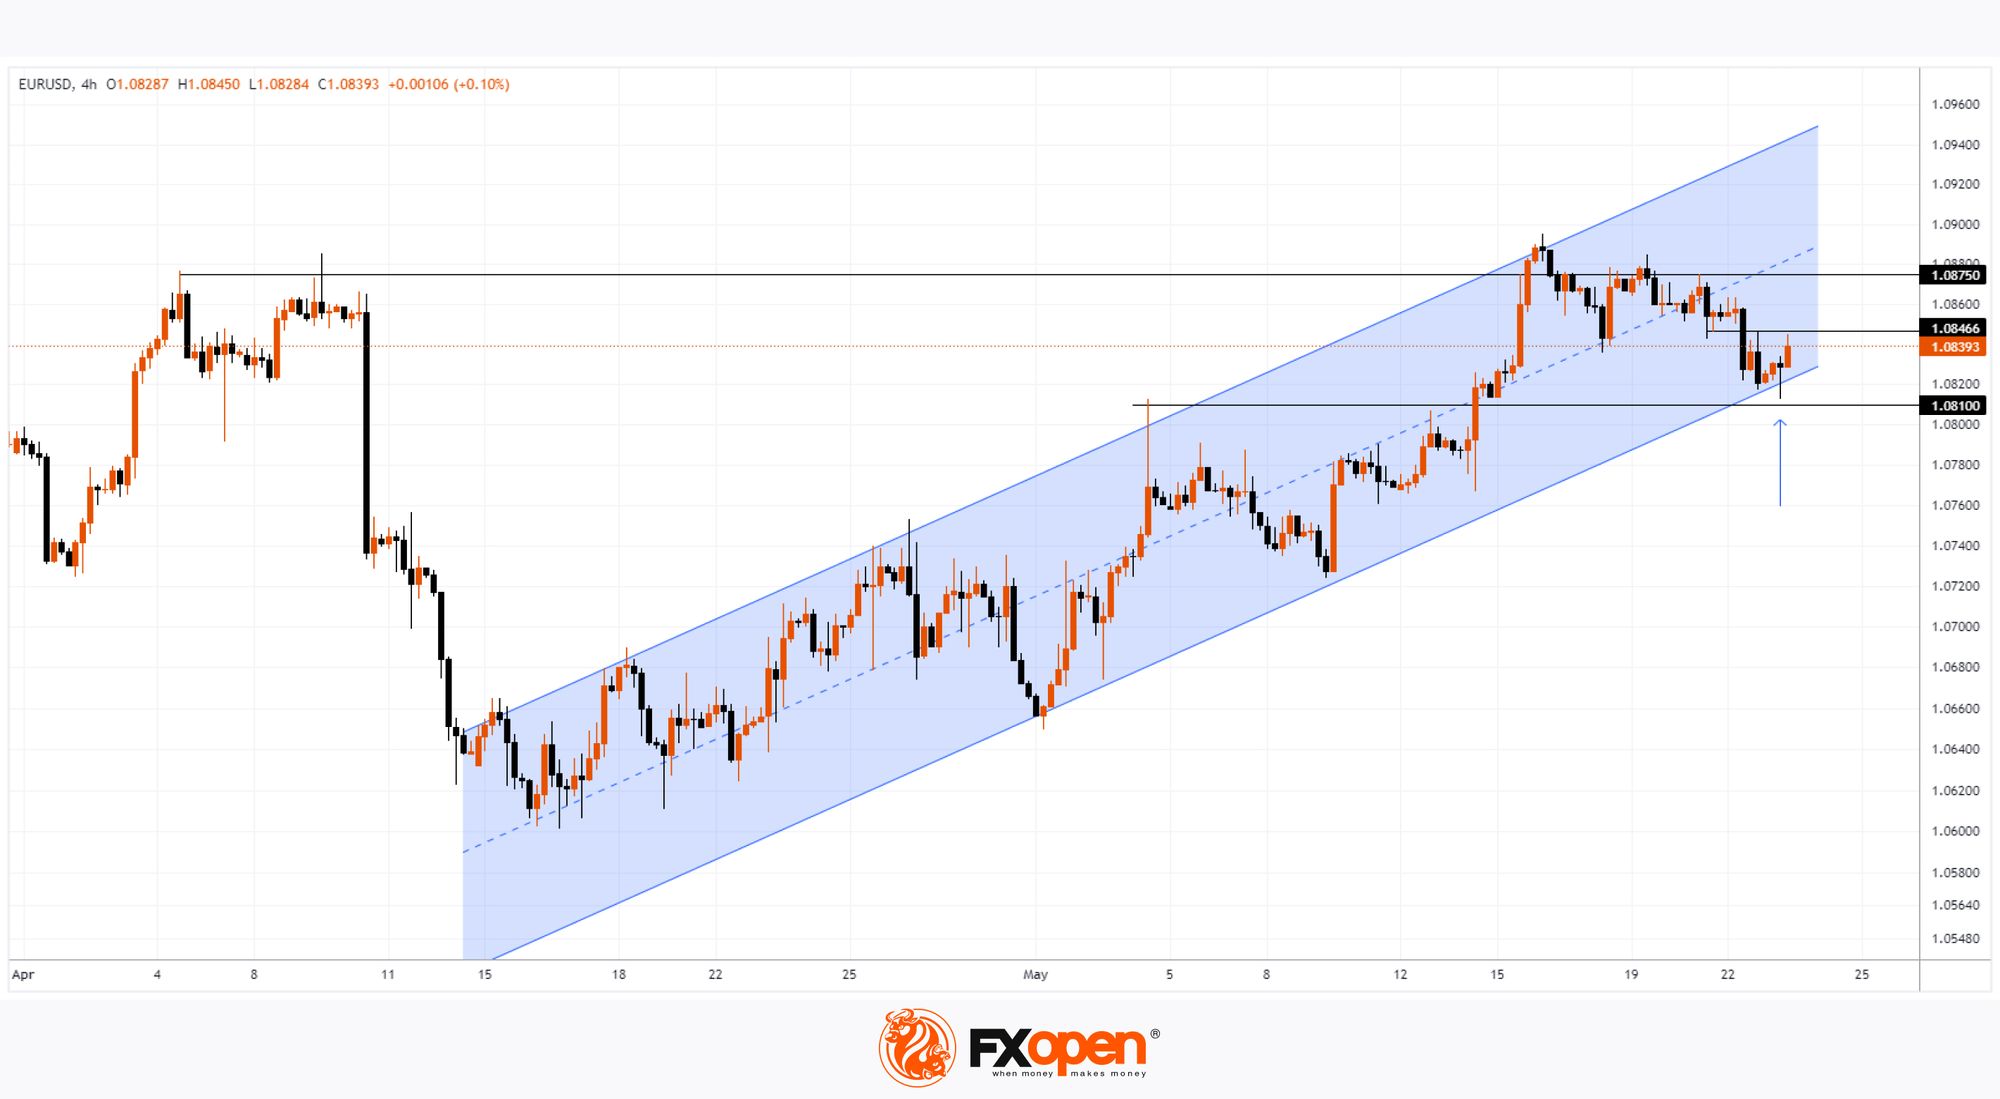
Technical analysis of the EUR/USD chart shows:
→ The price is within an ascending channel;
→ The 1.081 level served as resistance from 1-13 May but, following a bullish breakout on 14 May, now shows signs of support. This level is reinforced by the lower boundary of the ascending channel and the fundamental news mentioned above.
Thus, euro bulls might attempt to resume the trend and lift the EUR/USD rate to the significant resistance at 1.08750, established in April. The first test of their resolve could be the former support at 1.08466.
Trade over 50 forex markets 24 hours a day with FXOpen. Take advantage of low commissions, deep liquidity, and spreads from 0.0 pips (additional fees may apply). Open your FXOpen account now or learn more about trading forex with FXOpen.
This article represents the opinion of the Companies operating under the FXOpen brand only. It is not to be construed as an offer, solicitation, or recommendation with respect to products and services provided by the Companies operating under the FXOpen brand, nor is it to be considered financial advice.
Stay ahead of the market!
Subscribe now to our mailing list and receive the latest market news and insights delivered directly to your inbox.


Latest articles

Weak Data Weigh on the Dollar: Market Awaits Trend Confirmation
The US dollar is retreating from recent highs, moving into a moderate correction after a prolonged period of gains. Pressure on the currency is building amid weaker-than-expected macroeconomic data, while market participants adopt a wait-and-see approach ahead of key labour

Market Analysis: EUR/USD Aims Recovery While USD/JPY Gives Back Recent Gains
EUR/USD is recovering losses from 1.1450. USD/JPY is correcting gains from 160.50 and might decline further below 158.00.
Important Takeaways for EUR/USD and USD/JPY Analysis Today
· The Euro struggled to stay in a

European Currencies Decline: Pound Hits New Lows, Euro Under Pressure
European currencies continue to weaken against the US dollar amid rising geopolitical tensions and increased demand for safe-haven and liquid assets. Market participants are reducing exposure to riskier instruments, putting pressure on both the euro and the pound. Additional support