


European Stock Index Shows Signs of Weakness
FXOpen

As the comparison chart shows, the ESX50 lags behind the US500. And this trend has been observed since mid-December, a period when central banks around the world published interest rate decisions and set expectations for the future. The divergence suggests that Europe's central bankers are in no rush to join the US turn to lower interest rates — even as investors continue to insist that they will have to accept easier monetary policy soon enough.
According to Bloomberg, after Federal Reserve Chairman Jerome Powell signalled that the focus is now on lowering borrowing costs, colleagues from Frankfurt to London said that a further slowdown in inflation cannot be taken for granted. That is, for now in Europe, policy easing is not yet on the agenda.
“We should absolutely not lower our guard,” European Central Bank President Christine Lagarde told reporters in December, while her Bank of England counterpart Andrew Bailey noted there was “still work to be done” in the fight to rein in consumer prices.
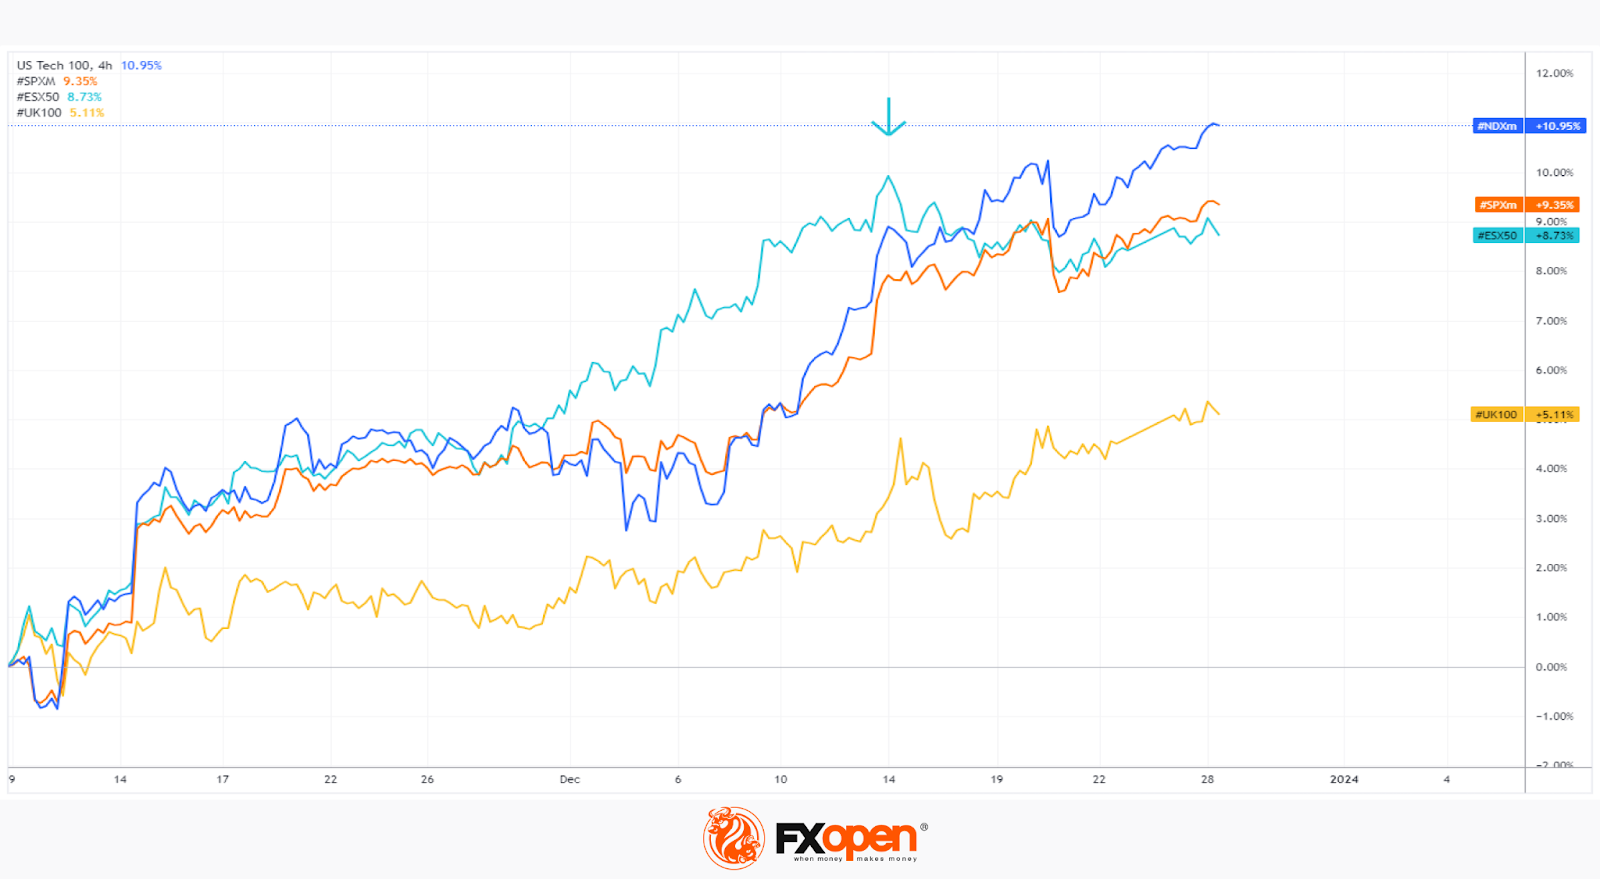
The chart shows that overall Western stock markets were positive in December, but a comparative analysis allows us to make interesting observations:
- the ESX50 index was the top gainer in December;
- but after a series of central bank meetings in the middle of the month (shown by the arrow), the lead was lost. While the S&P 500 is in close proximity to an all-time high, European stocks have lost bullish momentum.
It is possible that the mid-December highs will prove to be important resistance. And if a correction occurs in the stock market (which will be a reason to write about the end of the Santa rally), then the ESX50 will again be a leader, but in a downward trend.
Trade global index CFDs with zero commission and tight spreads (additional fees may apply). Open your FXOpen account now or learn more about trading index CFDs with FXOpen.
This article represents the opinion of the Companies operating under the FXOpen brand only. It is not to be construed as an offer, solicitation, or recommendation with respect to products and services provided by the Companies operating under the FXOpen brand, nor is it to be considered financial advice.
Stay ahead of the market!
Subscribe now to our mailing list and receive the latest market news and insights delivered directly to your inbox.


Latest articles

AI Valuations Are Back in the Spotlight
Artificial intelligence remains the dominant investment theme of 2026, but investors are increasingly questioning whether AI stock valuations are keeping pace with reality.
💰 Big Tech continues to invest at an unprecedented scale, with hyperscaler AI spending projected to exceed $800

AUD/CAD: Months of Indecision — Is a Breakout Finally Coming?
The Australian dollar has clawed back most of its end-of-June losses, when it touched three-month lows against the greenback amid escalating Middle East tensions. Since then, sentiment has improved: the RBA's Assistant Governor Sarah Hunter signalled the board stands ready

USD/JPY: Battling at the Top of the Triangle
On 3 July, Japan's Finance Minister, Satsuki Katayama, stated that the Ministry of Finance remains in close contact with US authorities regarding developments in USD/JPY as the yen traded near its weakest level in almost 40 years. Similar verbal