


FXOpen

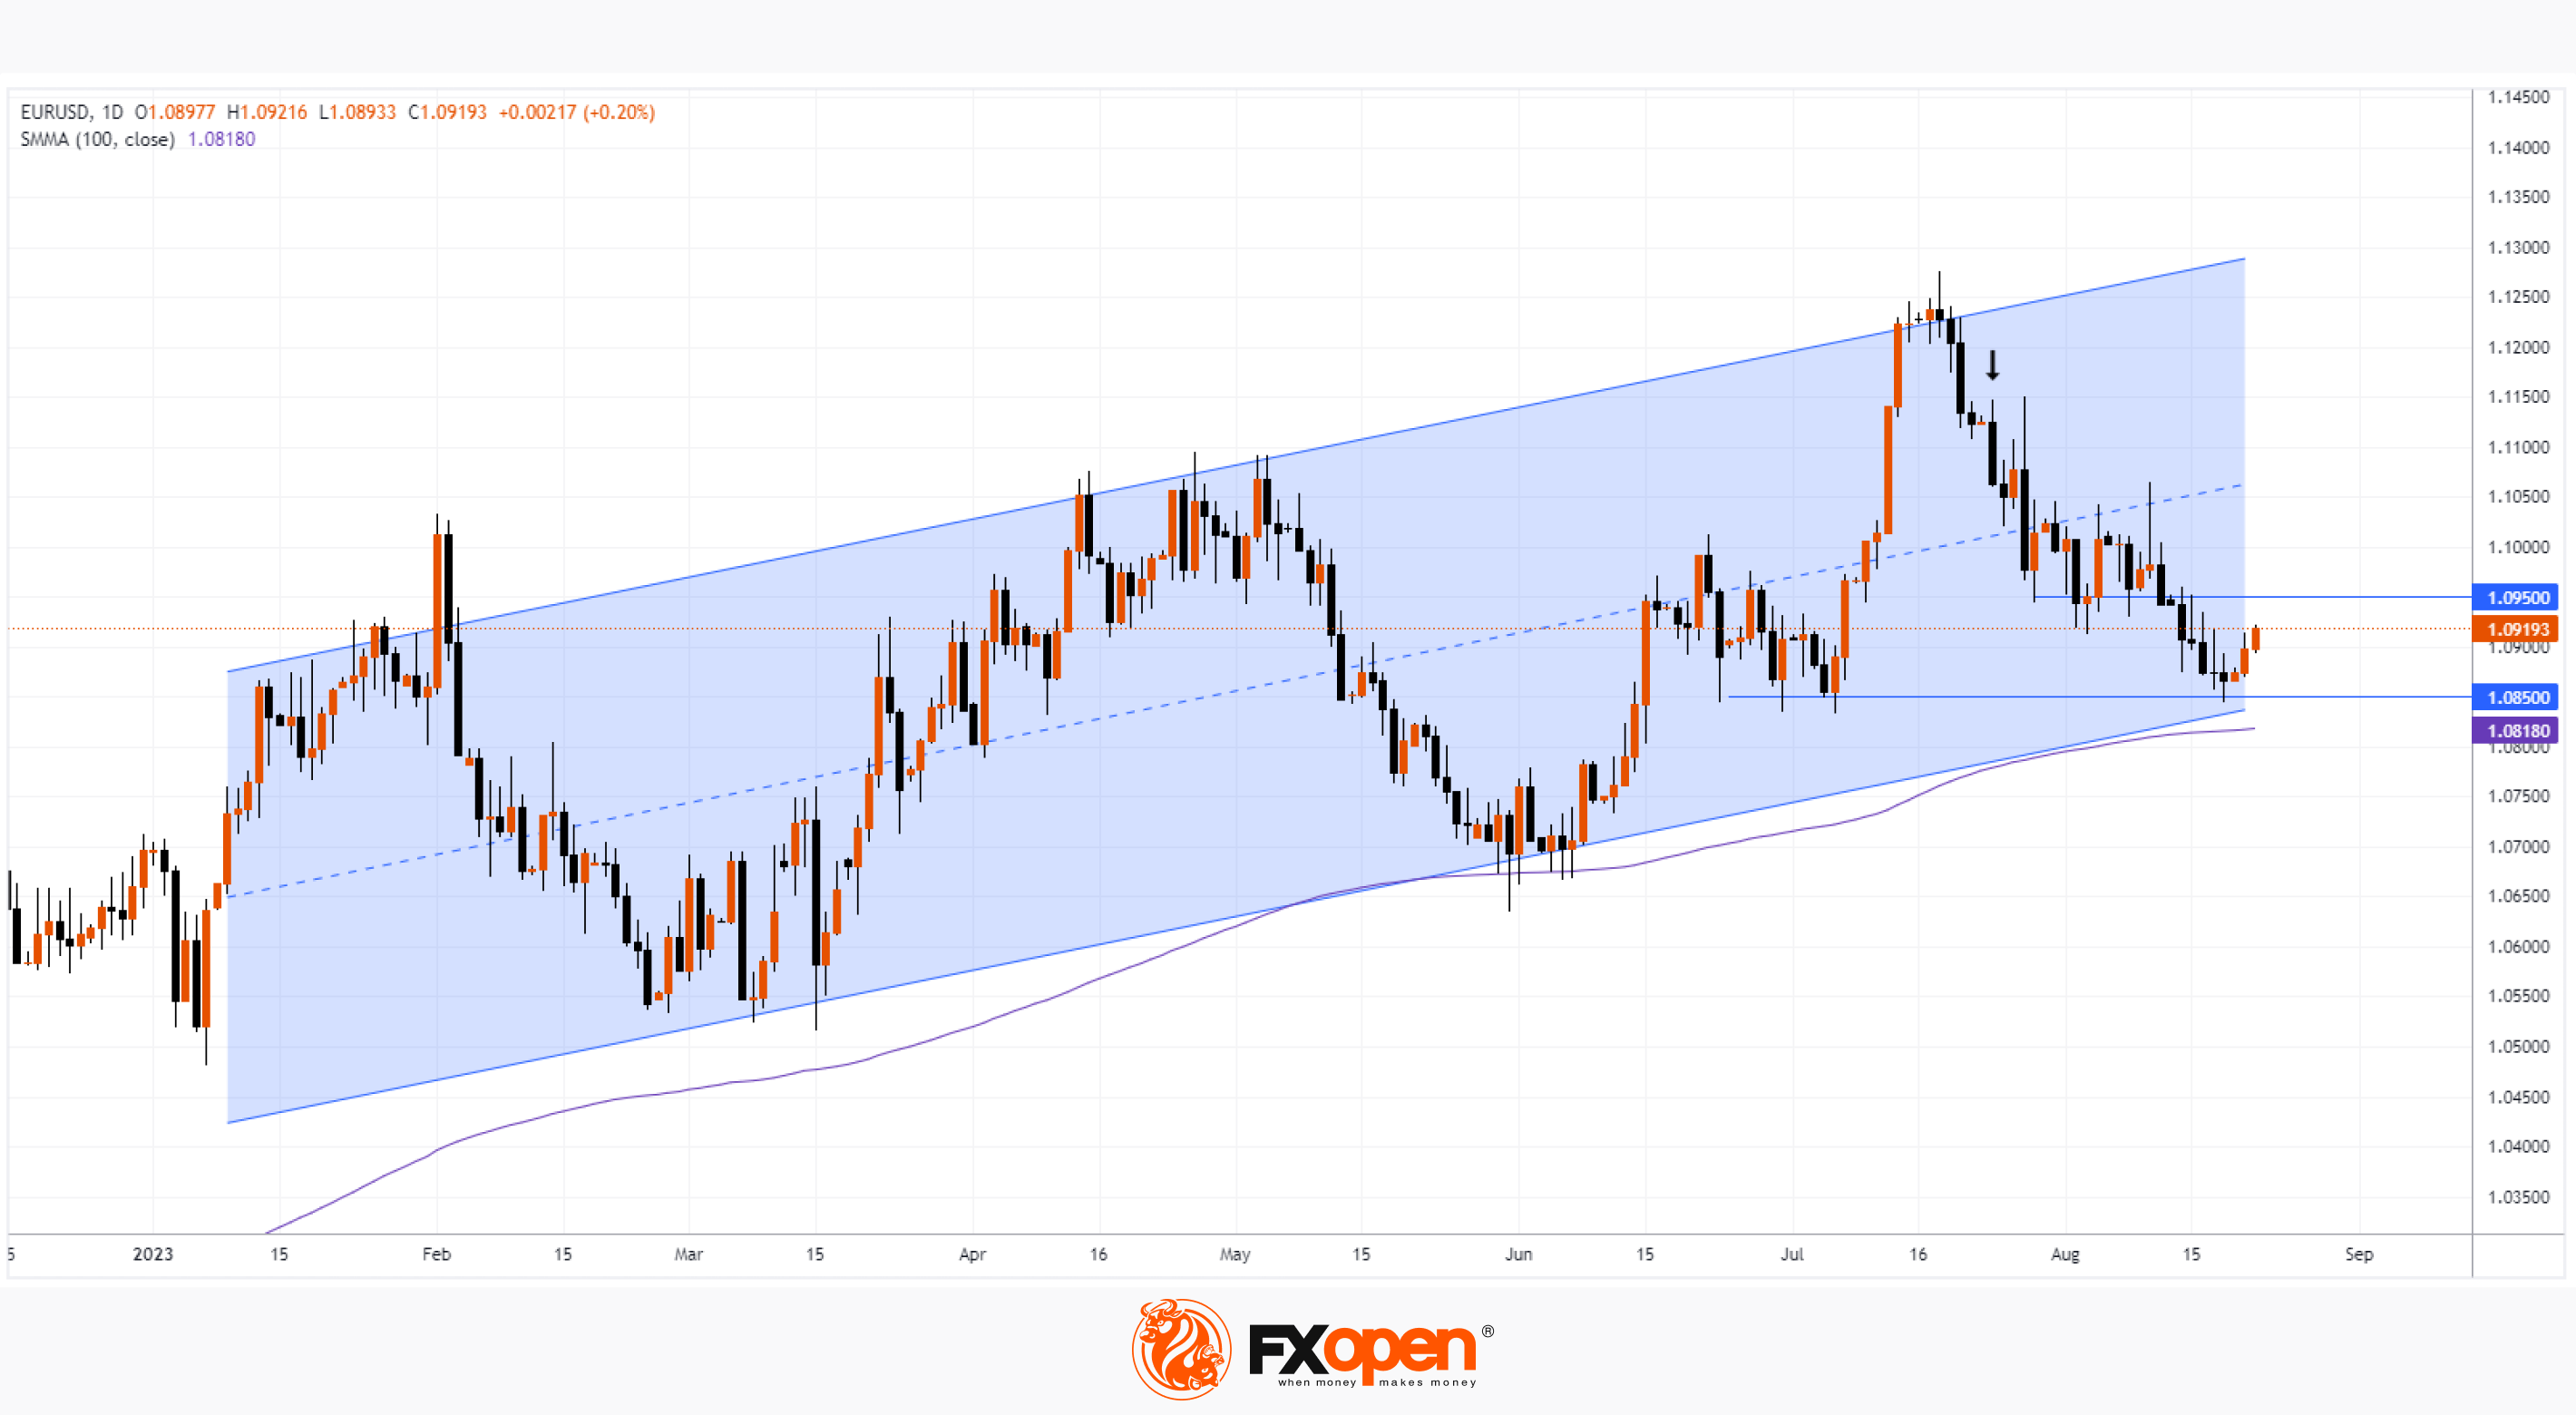
From the high of the year, set on July 18 near the level of 1.125, the price of EUR/USD fell in 1 month to the support of 1.085 (-3.4%). Today, the EUR/USD chart shows that the market is forming a rebound from this support, which has been in place since mid-June. What will be the further development?
Bullish arguments:
→ The market is in an uptrend (indicated by the blue channel) in 2023 and its lower boundary, which forms a powerful block of support at the level of 1.085, can help the bounce develop into a meaningful swing.
→ Support may come from SMA (100).
Bearish arguments:
→ The higher the price of EUR/USD rises, the closer the level of 1.095 becomes, which acted as support; but after the pin bar on August 10, the level was broken, and now resistance can be expected from it. If this is indeed the case, the market will form a weak bounce from the block of supports in the 1.085 area — a threatening sign for the current ascending channel.
Fundamental background:
→ Tomorrow morning (between 10:15 am and 11:00 am GMT+3) economic data from the Eurozone will be published, including the Purchasing Managers' Index (PMI), which is considered a leading indicator of the state of the economy. Last month, PMI values set multi-month lows, showing a slowdown in the economy in Europe, which led to a fall in the EUR/USD rate (shown by the arrow). It is possible that the market will get a new reason for a bearish momentum.
→ The media are writing about the weakening of the dollar on the eve of the symposium in Jackson Hole, where Powell is scheduled to speak on August 25. If the head of the Fed is clearly leaving the doors open for new rate hikes, this will allow the dollar to strengthen and put pressure on the EUR/USD rate.
Trade over 50 forex markets 24 hours a day with FXOpen. Take advantage of low commissions, deep liquidity, and spreads from 0.0 pips (additional fees may apply). Open your FXOpen account now or learn more about trading forex with FXOpen.
This article represents the opinion of the Companies operating under the FXOpen brand only. It is not to be construed as an offer, solicitation, or recommendation with respect to products and services provided by the Companies operating under the FXOpen brand, nor is it to be considered financial advice.
Stay ahead of the market!
Subscribe now to our mailing list and receive the latest market news and insights delivered directly to your inbox.


Latest articles

Consolidation Ahead of NFP: Commodity Currencies Search for Direction
Commodity-linked currencies have entered a consolidation phase following recent directional moves, as market participants adopt a wait-and-see approach ahead of key US labour market data. Current price action reflects a balance between ongoing demand for the US dollar and attempts

The Real Driver Behind the Dollar Rally: Market Insights with Gary Thomson
The US dollar has been firm, but the drivers behind the move may be more complex than they first appear.
While geopolitical tension and shifts in risk sentiment play a role, current price behaviour seems increasingly influenced by inflation expectations

EUR/USD and USD/CHF Pull Back: Market Reacts to Fundamentals
European currencies have shown a recovery in recent trading sessions after their recent decline, displaying early signs of a reversal. The US dollar is weakening amid expectations surrounding upcoming US macroeconomic data, while market participants are reassessing their short-term positions