


FTSE 100 Index May Reach 8500
FXOpen

As shown on the chart of the UK stock index FTSE 100 (UK 100 on FXOpen):
→ It has risen by over 3% in three days;
→ It is near the record high set in May last year and may reach the psychological level of 8500 points.
Bullish sentiment has been supported by yesterday's news of GDP recovery – according to media reports, the economy grew by 0.1% in November 2024 (compared to a previous decline of 0.1%), primarily driven by the dominant services sector.
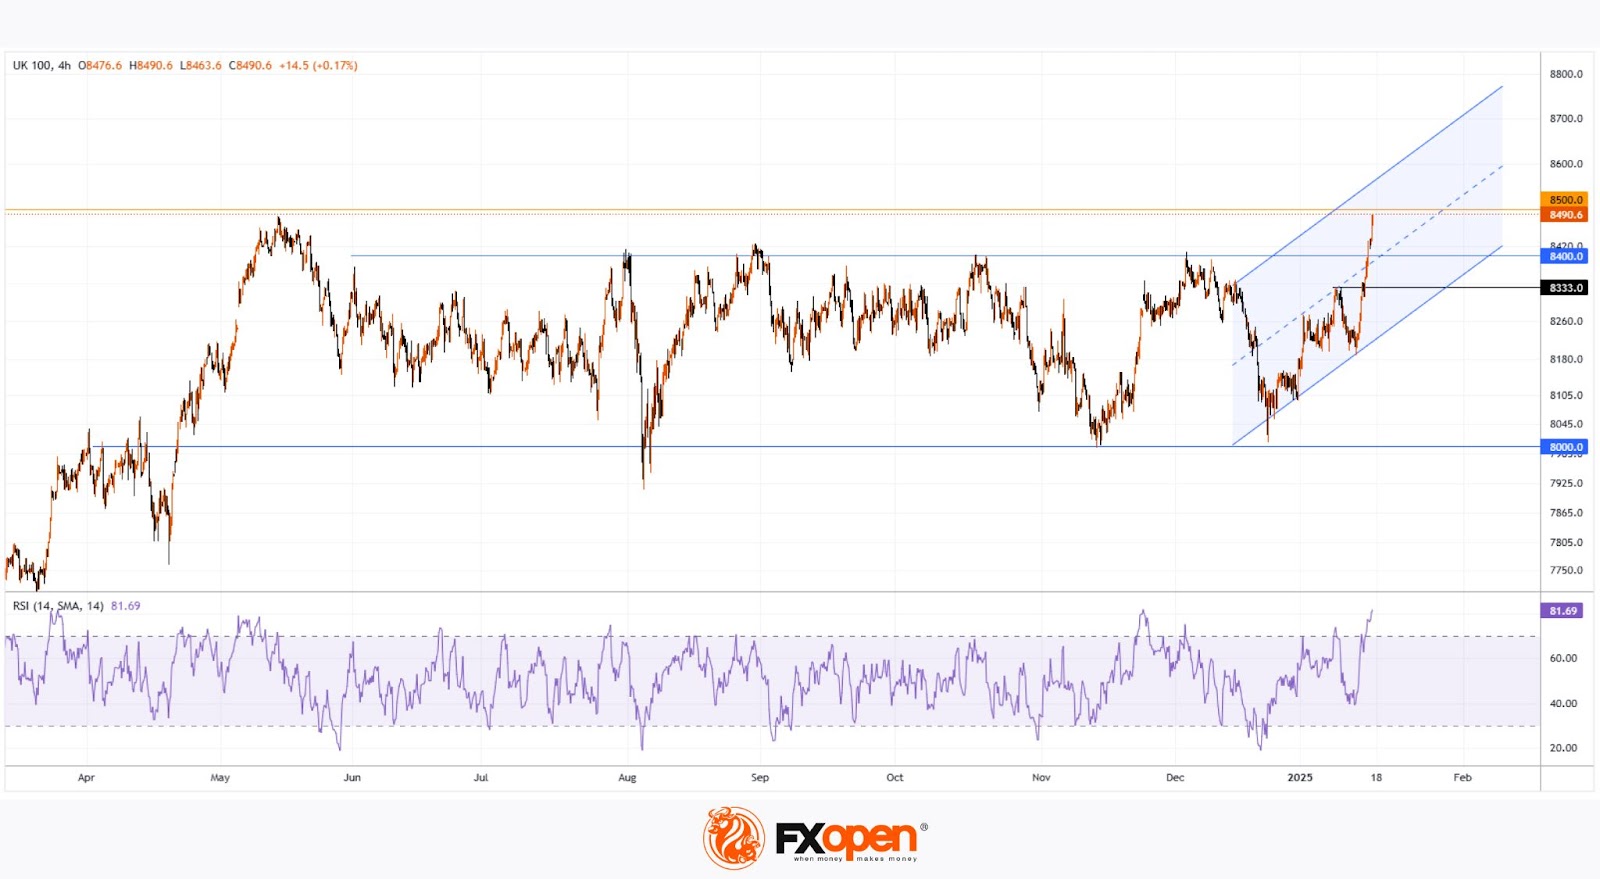
Technical analysis of the FTSE 100 (UK 100 on FXOpen) chart shows that since mid-2024, the index has predominantly fluctuated within the 8000–8400 range, only briefly moving beyond it, which was accompanied by spikes in the RSI indicator.
The current RSI level indicates strong overbought conditions, making the FTSE 100 (UK 100 on FXOpen) vulnerable to a pullback. Should this occur, it will provide important insights into the strength of demand. This could be assessed by the index’s ability to remain above the 8333 support level and the lower boundary of the ascending channel (marked in blue).
Potential challenges for bulls are highlighted by MT Newswires, which report that analysts forecast higher inflation and weaker growth in 2025, amid expectations of a significant rise in labour costs.
Trade global index CFDs with zero commission and tight spreads (additional fees may apply). Open your FXOpen account now or learn more about trading index CFDs with FXOpen.
This article represents the opinion of the Companies operating under the FXOpen brand only. It is not to be construed as an offer, solicitation, or recommendation with respect to products and services provided by the Companies operating under the FXOpen brand, nor is it to be considered financial advice.
Stay ahead of the market!
Subscribe now to our mailing list and receive the latest market news and insights delivered directly to your inbox.


Latest articles

Weekly Market Insights with Gary Thomson: US Inflation, UK GDP, Chair Warsh Testimony, and Earnings
In this video, we’ll explore the key economic events and market trends, shaping the financial landscape. Get ready for insights into financial markets to help you navigate the week ahead. Let’s dive in!
In this episode of Market

GBP/AUD Analysis: The Tug-of-War Begins
Oil is back in the driver's seat, and both the pound and the aussie are feeling its grip. The Bank of England held rates at 3.75% in June, but with UK inflation at 2.8% and crude oil climbing

Australian Dollar Holds Above the Current Market Profile
The minutes from the Reserve Bank of Australia's (RBA) June meeting, released on 30 June, suggested that policymakers are not yet ready to rule out further policy tightening. Board members noted persistent excess demand and broad-based inflationary pressures across the