


FXOpen

According to CNN, the economies of the UK and Japan entered a technical recession last week as data showed a second consecutive quarterly decline in gross domestic product. And if in the UK the economic downturn can be associated with high inflation and the strict policies of the Bank of England, then in Japan the reason may be the population decline (which has been going on for 14 years in a row).
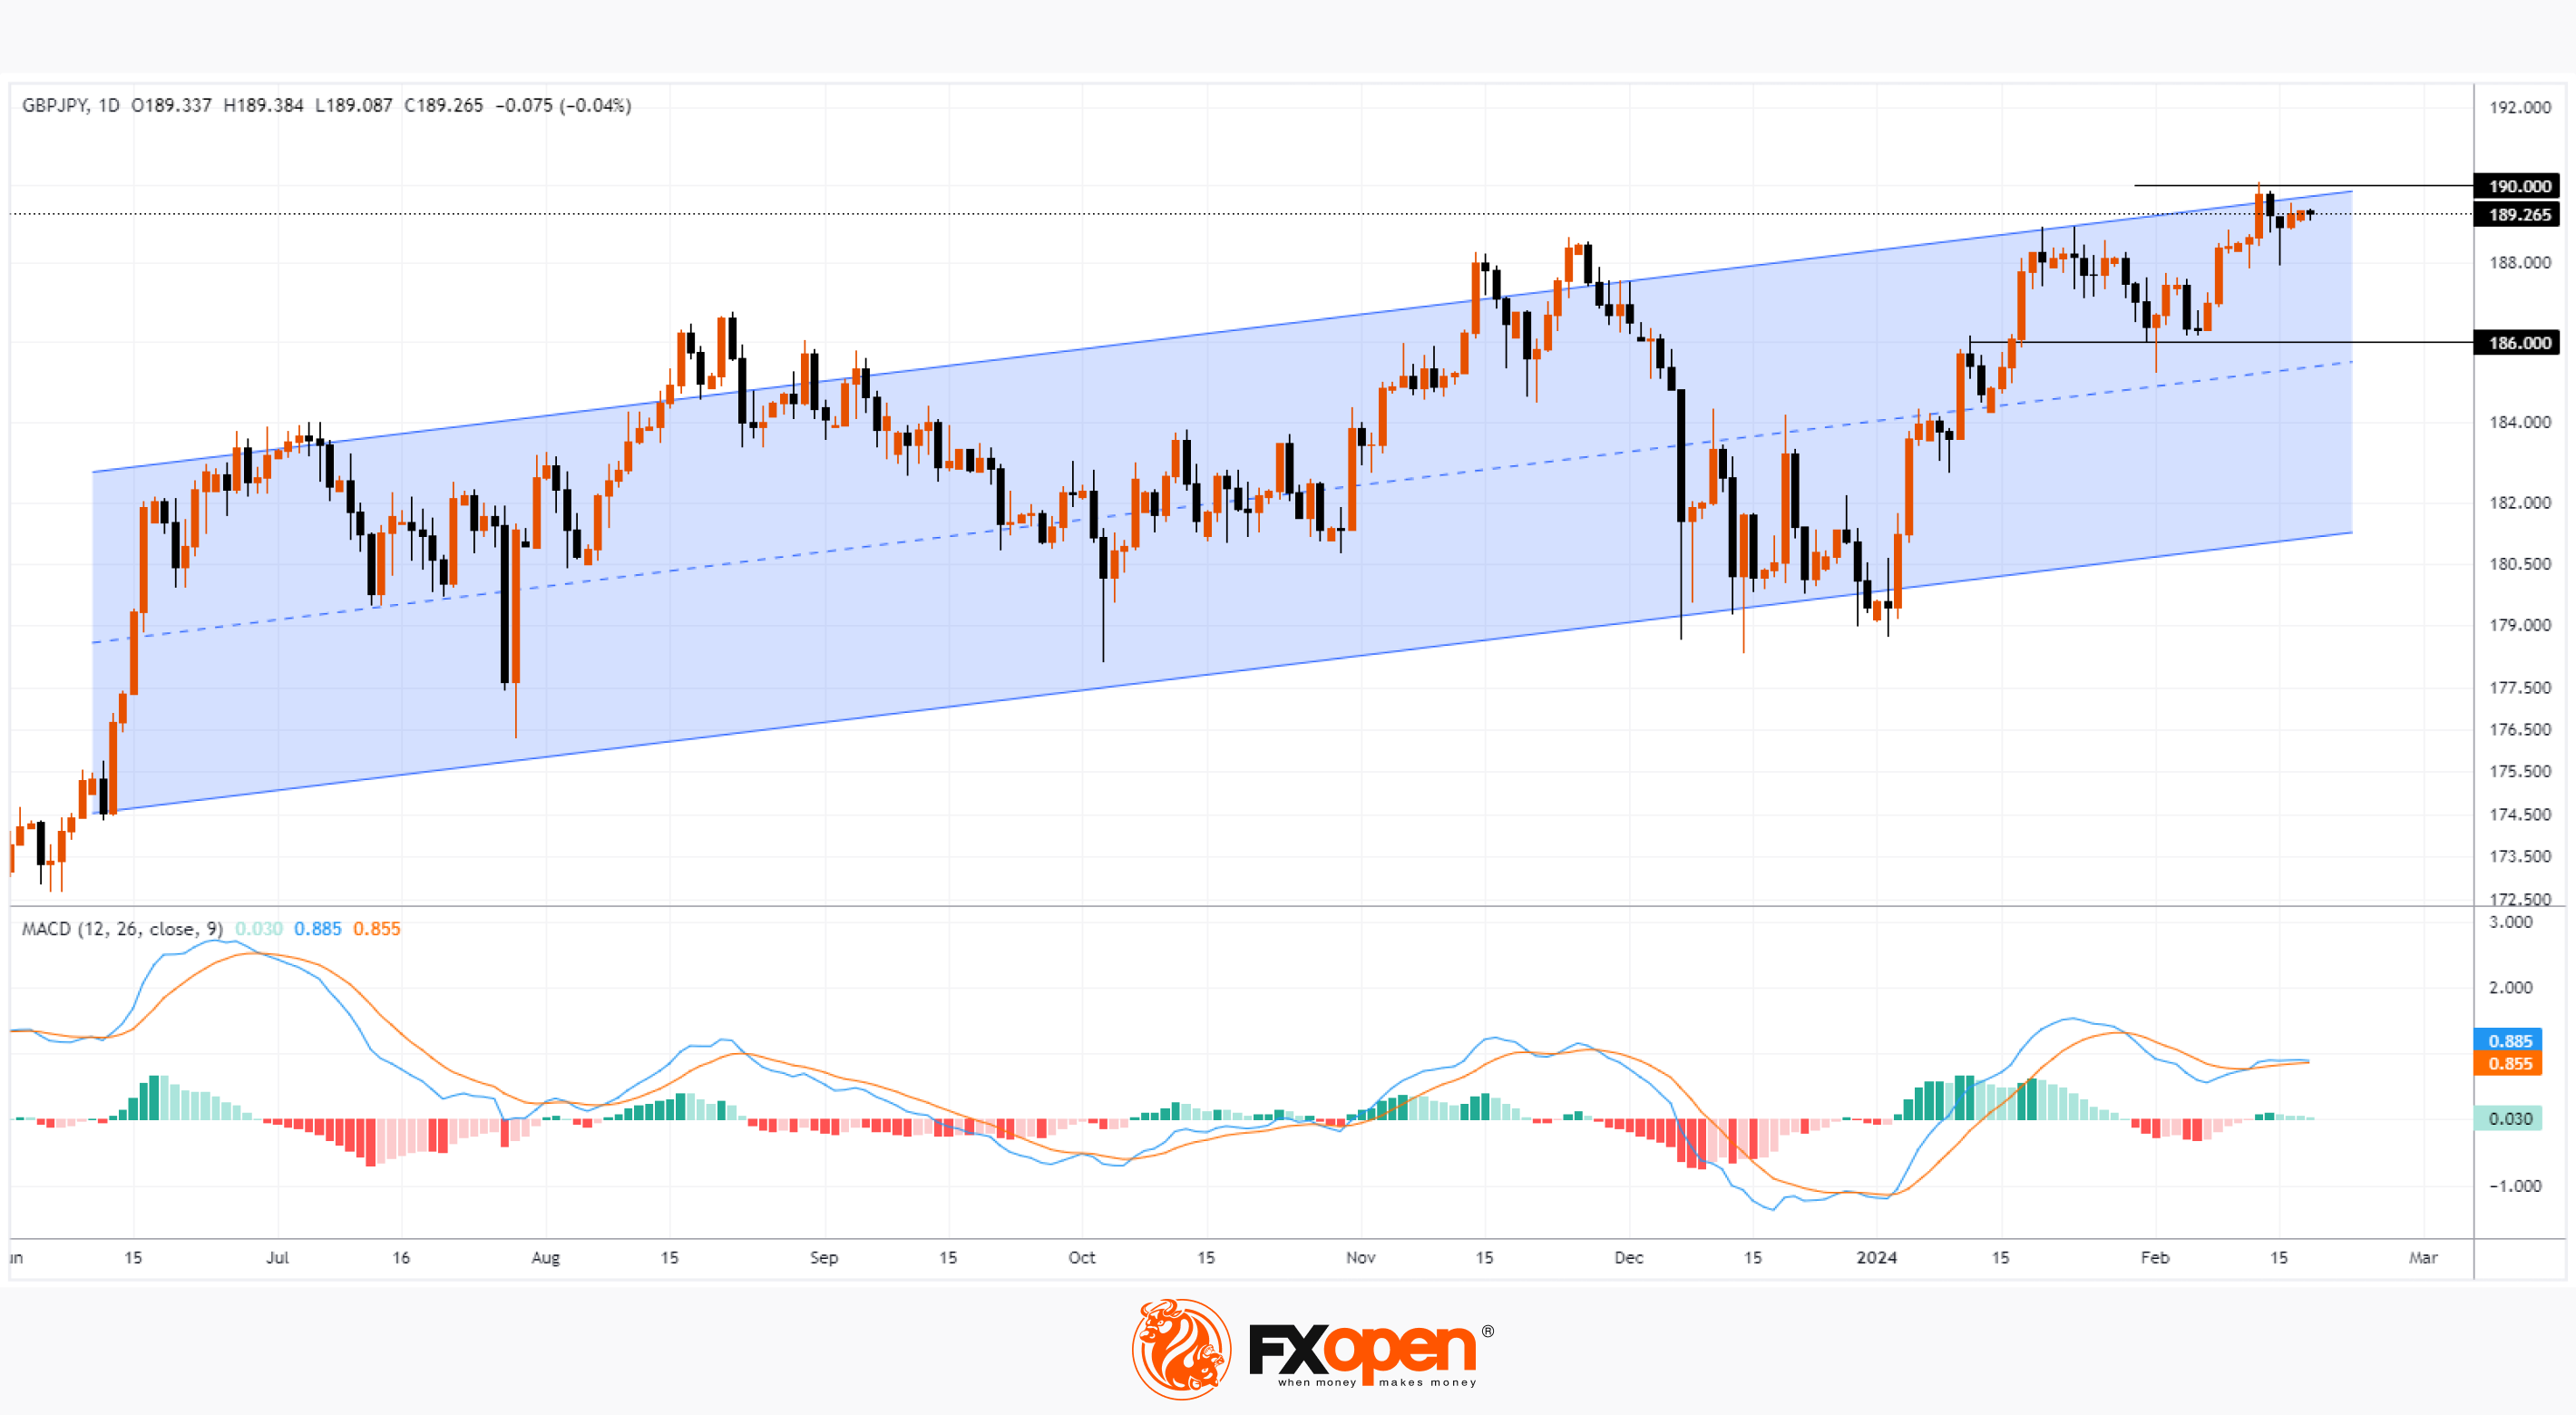
At the same time, the GBP/JPY chart shows that last week the rate exceeded 190 yen per pound for the first time since August 2015.
However:
→ the price is at the upper border of the ascending channel (shown in blue);
→ at the beginning of this week, the price of GBP/JPY is below the 190 yen level – and a false bullish breakout of the psychological level should be regarded as a bearish sign;
→ the MACD indicator indicates that demand forces are fading.
Perhaps market participants are inclined to take profits from longs. Since it is possible that the Japanese authorities are able to announce some decisions aimed at supporting the yen. In this case, one of the immediate targets for the bears may be the level of 186 yen per pound – where the support level (formerly the resistance level) is located, reinforced by the median line of the long-term channel.
Trade over 50 forex markets 24 hours a day with FXOpen. Take advantage of low commissions, deep liquidity, and spreads from 0.0 pips (additional fees may apply). Open your FXOpen account now or learn more about trading forex with FXOpen.
This article represents the opinion of the Companies operating under the FXOpen brand only. It is not to be construed as an offer, solicitation, or recommendation with respect to products and services provided by the Companies operating under the FXOpen brand, nor is it to be considered financial advice.
Stay ahead of the market!
Subscribe now to our mailing list and receive the latest market news and insights delivered directly to your inbox.


Latest articles

Weak Data Weigh on the Dollar: Market Awaits Trend Confirmation
The US dollar is retreating from recent highs, moving into a moderate correction after a prolonged period of gains. Pressure on the currency is building amid weaker-than-expected macroeconomic data, while market participants adopt a wait-and-see approach ahead of key labour

Market Analysis: EUR/USD Aims Recovery While USD/JPY Gives Back Recent Gains
EUR/USD is recovering losses from 1.1450. USD/JPY is correcting gains from 160.50 and might decline further below 158.00.
Important Takeaways for EUR/USD and USD/JPY Analysis Today
· The Euro struggled to stay in a

European Currencies Decline: Pound Hits New Lows, Euro Under Pressure
European currencies continue to weaken against the US dollar amid rising geopolitical tensions and increased demand for safe-haven and liquid assets. Market participants are reducing exposure to riskier instruments, putting pressure on both the euro and the pound. Additional support