FXOpen

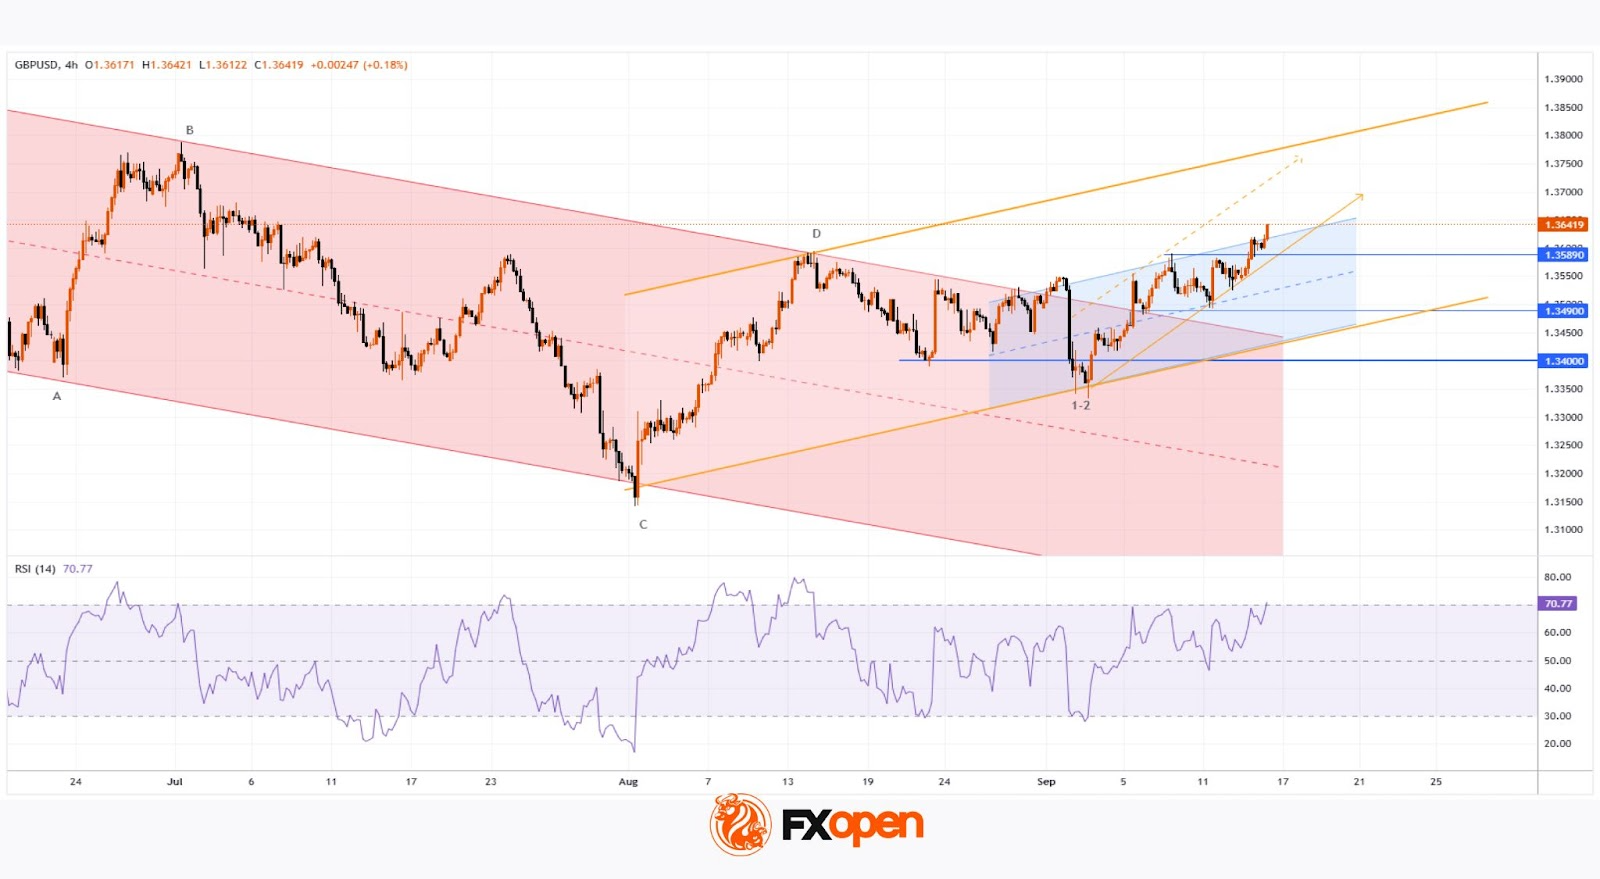
As the GBP/USD chart shows, the pair is trading this morning above 1.3620 – its highest level since the beginning of July.
The bullish sentiment is driven by the divergence in central bank policies:
→ United States: Traders are betting on an interest rate cut, supported by President Trump. The Federal Reserve will announce its decision tomorrow at 21:00 GMT+3, and the market expects a reduction of at least 0.25%, from 4.25%–4.50% to 4.00%–4.25%.
→ United Kingdom: Traders anticipate the rate will remain at 4.00%. The Bank of England will announce its decision on Thursday at 14:00 GMT+3.
Although the rates of the two central banks are comparable, the situation differs: in the UK, inflation is more persistent and rate cuts are seen as risky, while in the US, President Trump is exerting pressure on the Fed’s leadership.
An additional boost for the pound comes from a wave of investment optimism linked to US President Donald Trump’s state visit to the UK. According to media reports, agreements worth around $10 billion are expected to be announced during the visit.
GBP/USD Technical Analysis
Looking at the price movements earlier this month, we noted lower highs and lower lows forming a bearish A→B→C→D structure. We also assumed that:
→ bulls could rely on support at the psychological level of 1.3400;
→ but if bearish pressure intensified, GBP/USD could fall towards the median of the descending channel.
Since then, the situation has changed considerably: bears failed to consolidate below 1.3400, and after a bullish double bottom pattern (1–2) formed, the price surged upwards.
At the same time, the GBP/USD chart highlights key signs of strong demand:
→ the descending (red) channel has been broken, and the bearish A→B→C→D structure is no longer relevant;
→ higher highs and higher lows confirm buyer dominance – providing grounds to outline a rising (blue) channel.
On the other hand, the RSI indicator is close to overbought territory, which suggests a possible pullback.
Potential support levels:
→ 1.34900: the breakout point where bulls started their advance;
→ 1.35890: a level that lost its resistance role this week;
→ the upper boundary and median of the blue ascending channel.
Taking all this into account, we could assume that in the near term, bulls may aim to lift GBP/USD towards the upper boundary of the yellow channel. It is also possible that news from the Fed and the Bank of England will aid them on this path.
Trade over 50 forex markets 24 hours a day with FXOpen. Take advantage of low commissions, deep liquidity, and spreads from 0.0 pips (additional fees may apply). Open your FXOpen account now or learn more about trading forex with FXOpen.
This article represents the opinion of the Companies operating under the FXOpen brand only. It is not to be construed as an offer, solicitation, or recommendation with respect to products and services provided by the Companies operating under the FXOpen brand, nor is it to be considered financial advice.
Stay ahead of the market!
Subscribe now to our mailing list and receive the latest market news and insights delivered directly to your inbox.


Latest articles

Oracle (ORCL) Shares Jump Above $160
Following a strong earnings report, Oracle shares surged above $160, marking roughly a 1.5-month high:
→ Earnings per share: expected $1.70, actual $1.79;
→ Revenue: expected $16.7bn, actual $17.2bn.
This is the first quarter in 15 years
USD/JPY Approaches Key Resistance Level
The USD/JPY chart shows a bullish trend at the start of March, influenced by the escalation of military activity in the Middle East.
On one hand, the US dollar is strengthening due to increased demand for safe-haven assets. On