


FXOpen

Today, the Consumer Price Index (CPI) figures for the UK were published. According to ForexFactory:
→ Annual CPI: actual = 2.3%; expected = 2.1%; previous = 3.2%.
→ Annual Core CPI: actual = 3.9%; expected = 3.6%; previous = 4.2%.
Thus, it can be asserted that:
→ The current inflation level is at its lowest since 2021.
→ It is close to the target levels of 2%.
However, economists polled by Reuters had expected a sharper drop to 2.1%, based on falling energy prices.
Additionally, inflation in the services sector (a key indicator monitored by the Bank of England due to the dominance of this sector in the UK economy) only slightly decreased to 5.9% from 6%.
As a result, CNBC reports that market participants have reduced the likelihood of the Bank of England easing monetary policy:
→ The probability of a rate cut in June has decreased to 15% compared to 50% before the inflation news was published.
→ The probability of a rate cut in August was estimated at 40% compared to 70% before the publication.
The currency market reacted with a surge in volatility – the GBP/USD rate jumped to a two-month high, reaching the 1.27555 level. However, as the market absorbed the data, the price began to gradually decline.
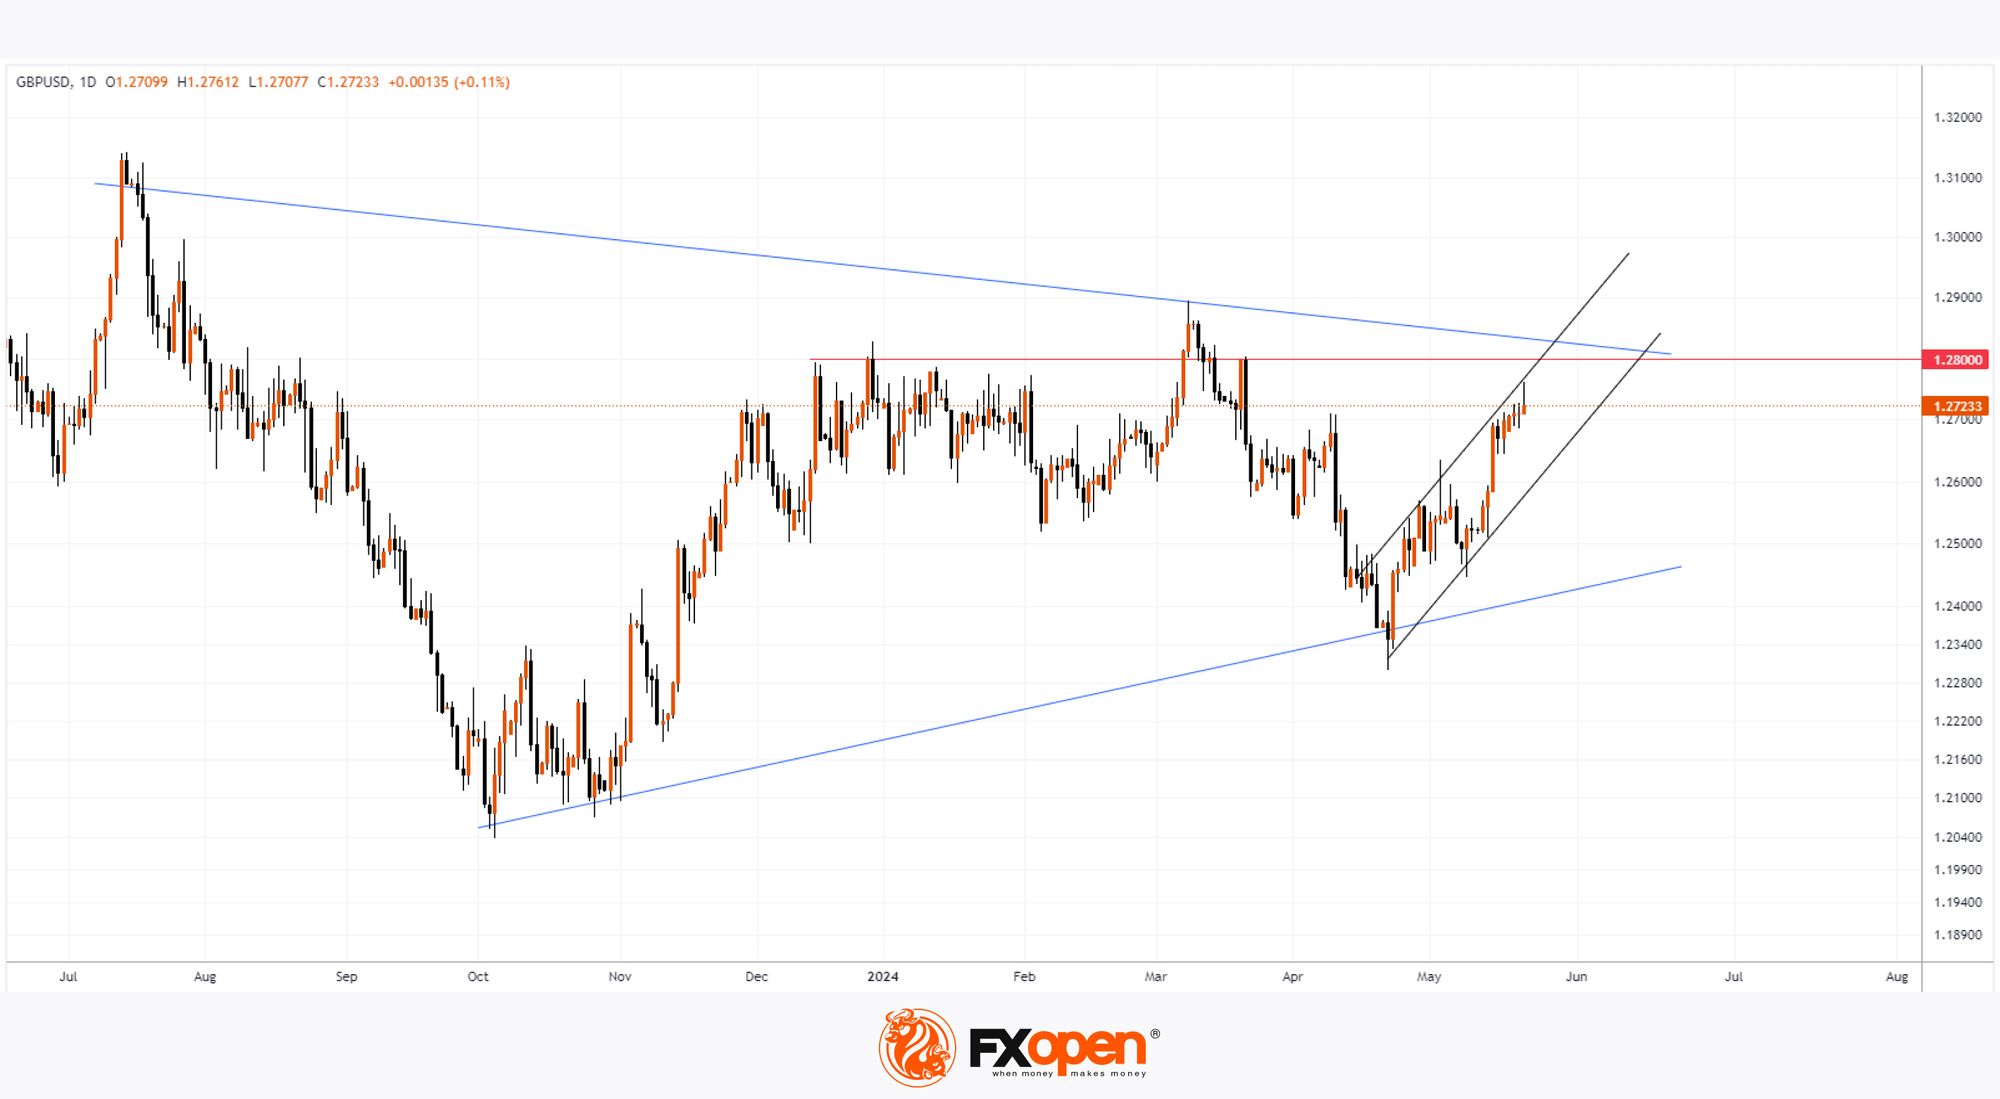
Technical analysis of the daily GBP/USD chart shows that:
→ The price is within a large narrowing triangle consolidation that started in 2023.
→ Within this triangle, the 1.2800 level plays a significant role – it provided resistance both last year and in 2024.
→ Today’s candlestick may form a long upper shadow, indicating continued bearish activity around the 1.2800 level.
→ This bearish activity could drive the price down to the lower boundary of the ascending channel (shown in black), which describes the trajectory of the GBP/USD price movement from the lower to the upper boundary of the triangle since mid-April.
At 21:00 GMT+3 today, the FOMC Meeting Minutes will be published – they are likely to have a strong impact on the dollar's exchange rate against other currencies. Be prepared for spikes in volatility.
Trade over 50 forex markets 24 hours a day with FXOpen. Take advantage of low commissions, deep liquidity, and spreads from 0.0 pips (additional fees may apply). Open your FXOpen account now or learn more about trading forex with FXOpen.
This article represents the opinion of the Companies operating under the FXOpen brand only. It is not to be construed as an offer, solicitation, or recommendation with respect to products and services provided by the Companies operating under the FXOpen brand, nor is it to be considered financial advice.
Stay ahead of the market!
Subscribe now to our mailing list and receive the latest market news and insights delivered directly to your inbox.


Latest articles

Consolidation Ahead of NFP: Commodity Currencies Search for Direction
Commodity-linked currencies have entered a consolidation phase following recent directional moves, as market participants adopt a wait-and-see approach ahead of key US labour market data. Current price action reflects a balance between ongoing demand for the US dollar and attempts

The Real Driver Behind the Dollar Rally: Market Insights with Gary Thomson
The US dollar has been firm, but the drivers behind the move may be more complex than they first appear.
While geopolitical tension and shifts in risk sentiment play a role, current price behaviour seems increasingly influenced by inflation expectations

EUR/USD and USD/CHF Pull Back: Market Reacts to Fundamentals
European currencies have shown a recovery in recent trading sessions after their recent decline, displaying early signs of a reversal. The US dollar is weakening amid expectations surrounding upcoming US macroeconomic data, while market participants are reassessing their short-term positions