


FXOpen

As the XAU/USD chart shows, gold has climbed above $4,400 today, setting a new all-time high.
On Friday, when analysing the gold chart, we highlighted a triangle formation and noted strong selling pressure near the previous record high around $4,380, set in October.
However, over the weekend geopolitical tensions intensified following reports that the United States detained an oil tanker linked to Venezuela. At the turn of the week, this resulted in a clear triangle breakout (as indicated by the arrow):
→ during the second half of Friday’s session, gold moved above the upper boundary of the pattern;
→ at the Asian open, the price turned higher after retesting that level, with former resistance acting as support.
As a result, concerns about a potential armed conflict involving the US have shifted the balance of supply and demand decisively higher.
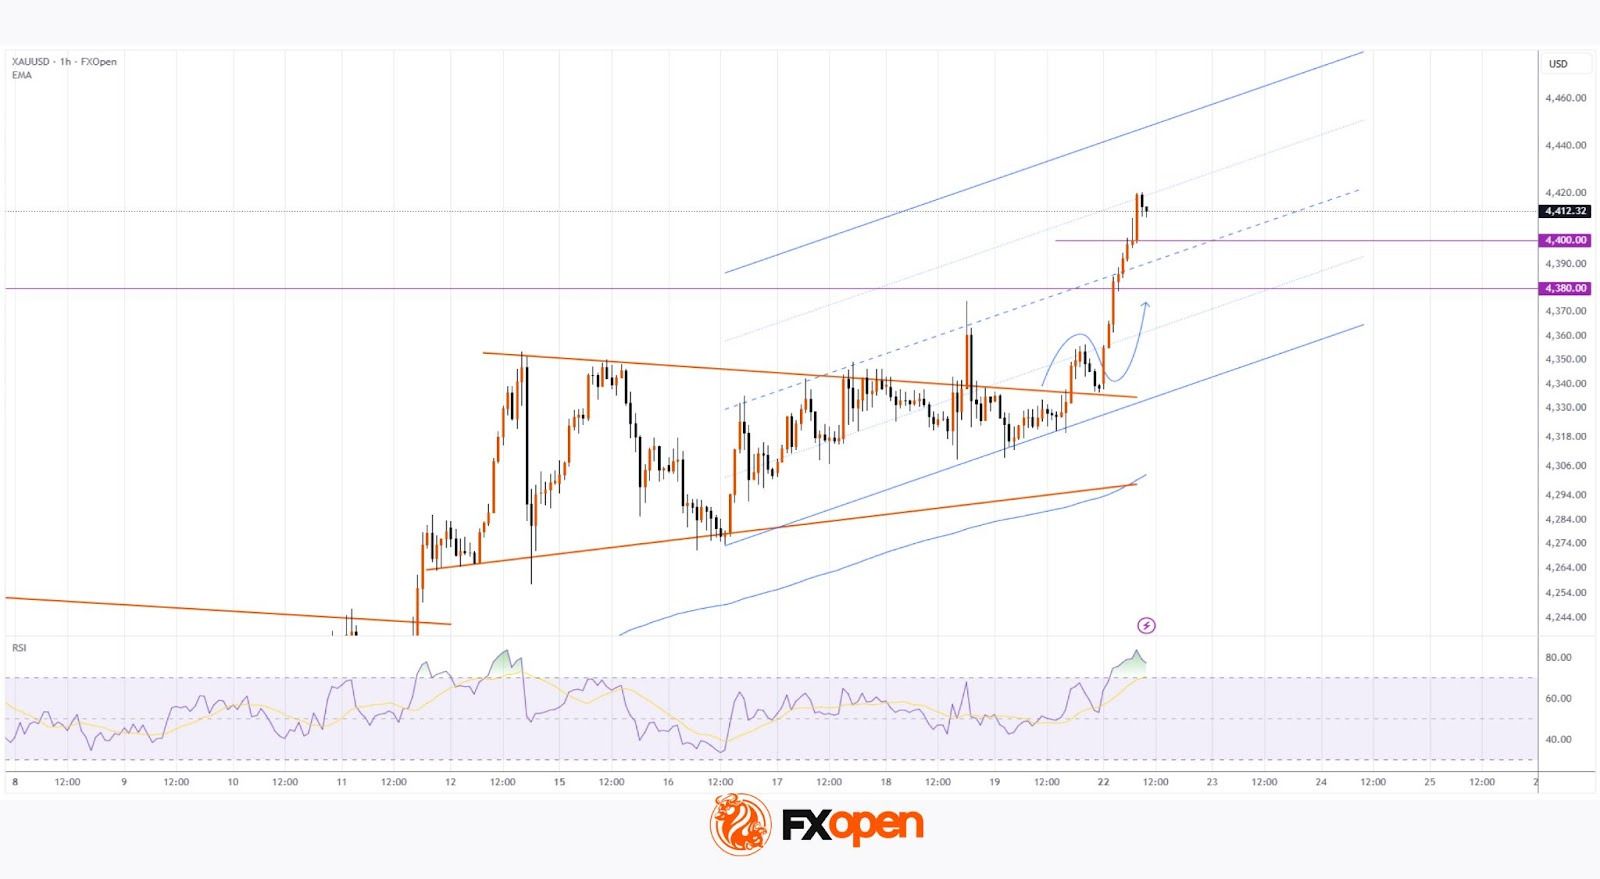
The bullish momentum has justified the construction of an ascending channel. It is worth noting that the RSI indicator is currently in overbought territory. Intraday trading during the US session could therefore bring some corrective pullback, with potential support coming from:
→ the lower boundary of the newly formed channel;
→ the area between the previous peak at $4,380 and the psychological $4,000 level.
According to Goldman Sachs analysts, structural demand from central banks combined with falling interest rates could drive gold prices towards $4,900 by the end of 2026.
Start trading commodity CFDs with tight spreads (additional fees may apply). Open your trading account now or learn more about trading commodity CFDs with FXOpen.
This article represents the opinion of the Companies operating under the FXOpen brand only. It is not to be construed as an offer, solicitation, or recommendation with respect to products and services provided by the Companies operating under the FXOpen brand, nor is it to be considered financial advice.
Stay ahead of the market!
Subscribe now to our mailing list and receive the latest market news and insights delivered directly to your inbox.


Latest articles

EUR/USD Chart Analysis: Pair Recovers Ahead of Fed News
On 10 March, analysing the EUR/USD chart, we:
→ considered the long-term descending channel, which remains relevant;
→ noted that the sequence of lower lows A–H was broken with the appearance of a higher peak I, with 1.1680 potentially

Nvidia (NVDA) Shares Set a March High
Nvidia shares experienced heightened volatility yesterday, with the price jumping to a March high during the Nvidia GTC 2026 conference, where Jensen Huang made several major announcements. According to media reports:
→ Nvidia unveiled a next-generation platform named after the astronomer

XTI/USD Chart Analysis: WTI Oil Price Fluctuates Near $100
For the third Monday in a row, trading in the oil market has opened with a bullish gap, although this time it is not as wide as the gap seen, for example, on 9 March. The reason for the volatility