


Gold Price Breaks Above $5,000 for the First Time
FXOpen

At the market open on Monday, 26 January, gold prices (XAU/USD) formed a bullish gap and moved above the psychological $5,000 level. The rally then continued, with prices climbing close to $5,100.
Strong bullish momentum across precious metals markets has pushed gold up by around 18% since the start of the year, while silver has surged by approximately 50%.
Why Is Gold Rising?
The bullish tone is being driven by a combination of a weaker US dollar and heightened demand for safe-haven assets, shaped by the current environment:
→ The “Greenland issue”: renewed attempts by the Trump administration to acquire Greenland have escalated into a standoff with the EU, bringing the risk of a trade war.
→ Growing concerns about political pressure on the Federal Reserve and the stability of US monetary policy, given the US President’s intention to push for lower interest rates.
→ Central bank demand, harsh rhetoric from the White House towards Canada following its agreement with China, and ongoing tensions surrounding Iran.
All of this is fuelling an unstoppable bullish market. Under such conditions, is a decline in gold prices even possible?
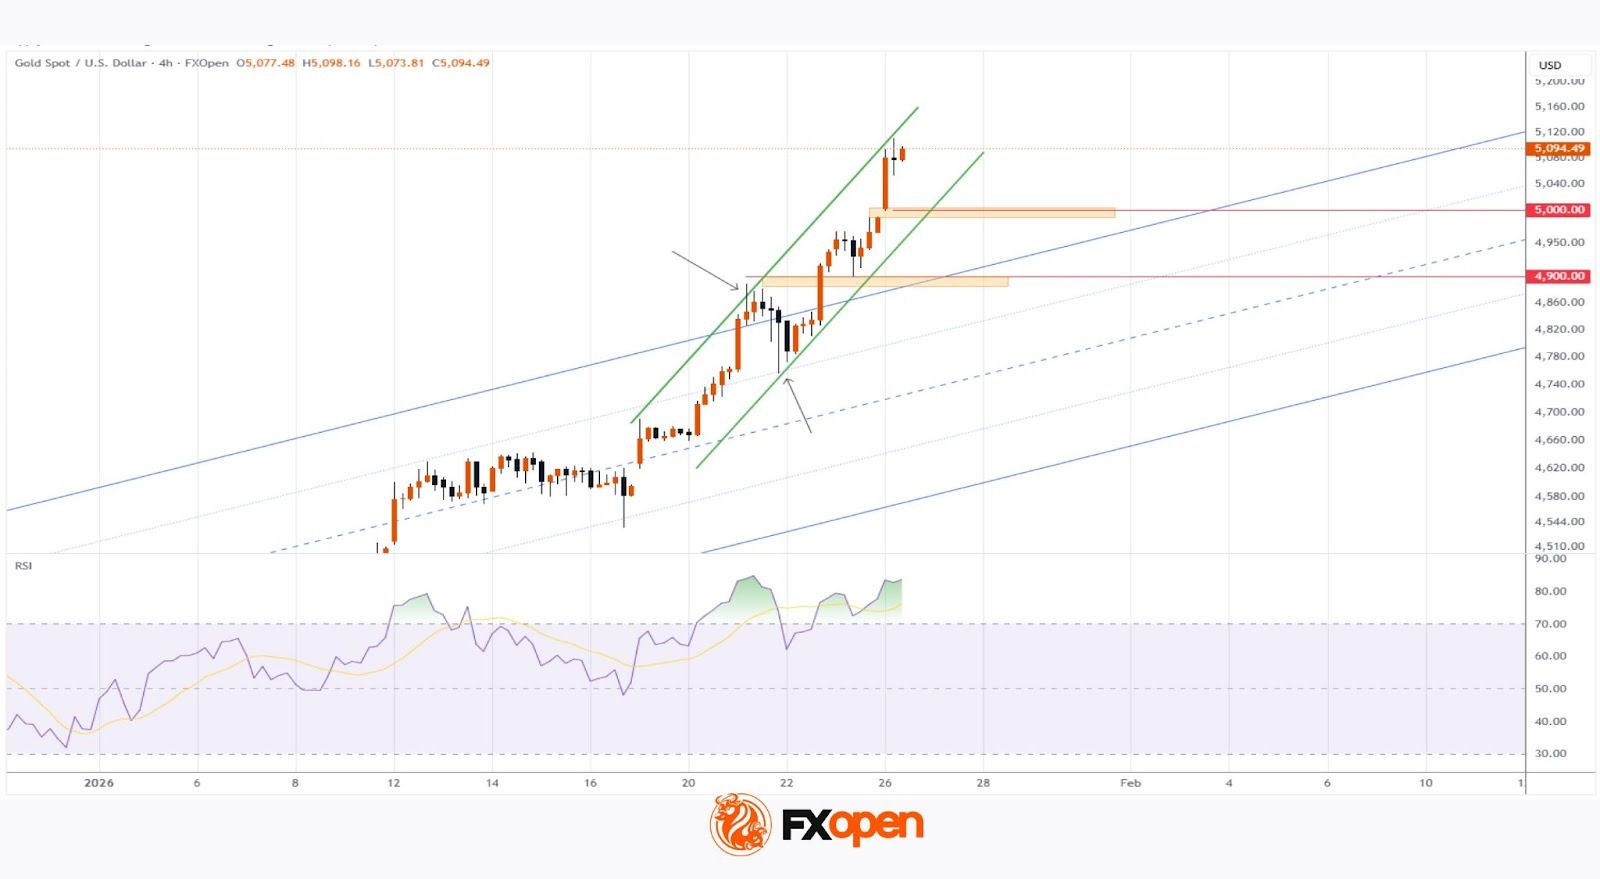
Technical Analysis of the XAU/USD Chart
Six days ago, on 20 January, when analysing the gold chart, we:
→ constructed an ascending channel;
→ highlighted signs of market overbought conditions;
→ maintained a bullish outlook, suggesting that even if pullback attempts occurred, they were unlikely to be deep and that the boundaries of the rising channel would continue to define the market’s trajectory.
Since then, gold prices have exceeded even the boldest expectations:
→ after reaching overbought levels near the upper boundary (indicated by the first arrow), the market formed only a shallow correction;
→ bulls stepped in near the line dividing the upper half of the channel into quarters (indicated by the next arrow), then demonstrated their strength by pushing prices firmly above the upper boundary.
The steeper angle formed by the green trendlines points to the speculative and euphoric nature of demand.
From a technical perspective, the XAU/USD market is extremely overbought, as confirmed by the RSI indicator, creating the conditions for a corrective move — for example, a retest of the $5,000 psychological level or the bullish gap area around $4,900.
However, against an exceptionally strong fundamental backdrop, revising expectations seems premature. A reversal of the prevailing trend would require truly major and transformative events.
Start trading commodity CFDs with tight spreads (additional fees may apply). Open your trading account now or learn more about trading commodity CFDs with FXOpen.
This article represents the opinion of the Companies operating under the FXOpen brand only. It is not to be construed as an offer, solicitation, or recommendation with respect to products and services provided by the Companies operating under the FXOpen brand, nor is it to be considered financial advice.
Stay ahead of the market!
Subscribe now to our mailing list and receive the latest market news and insights delivered directly to your inbox.


Latest articles

CAD/JPY: The Yen's Most Historic Move in 30 Years Meets a Fragile Support
Two central banks are heading in genuinely opposite directions this week, and the tension is unmistakable. The Bank of Canada held rates steady at 2.25% on September 2, with a mildly hawkish tilt as policymakers acknowledged a broadening economic

USD/JPY and USD/CAD Await Key Fed Decision
The US dollar is consolidating against the yen and Canadian dollar ahead of the key event of the week — the Federal Reserve meeting. The Fed is widely expected to raise its policy rate by 25 basis points to a range

UnitedHealth: Fundamentals Are Healing, Now the Chart Must Agree
UnitedHealth finds itself in a genuinely split narrative right now, trading near $388, down about 15.9% from its 52-week high, even as the fundamental picture keeps improving. Q2 earnings beat expectations, with revenue of $112.03 billion, and the