


FXOpen
The price of gold has fallen by more than 3.6% over 2 days, as indicated by today's XAU/USD chart. The day before yesterday, at the opening of the daily candle, the price of gold was $2421 per ounce, and yesterday at the close it was $2331.
This can be explained by market participants expecting higher Federal Reserve interest rates for a longer period. However, although gold is a hedge against inflation, it has two drawbacks:
→ It does not inherently generate income;
→ The gold market may be overvalued – after all, a historical peak was reached on May 20th.
Therefore, investors are increasingly paying attention to bonds – they also allow hedging against inflation, while their yields are rising.
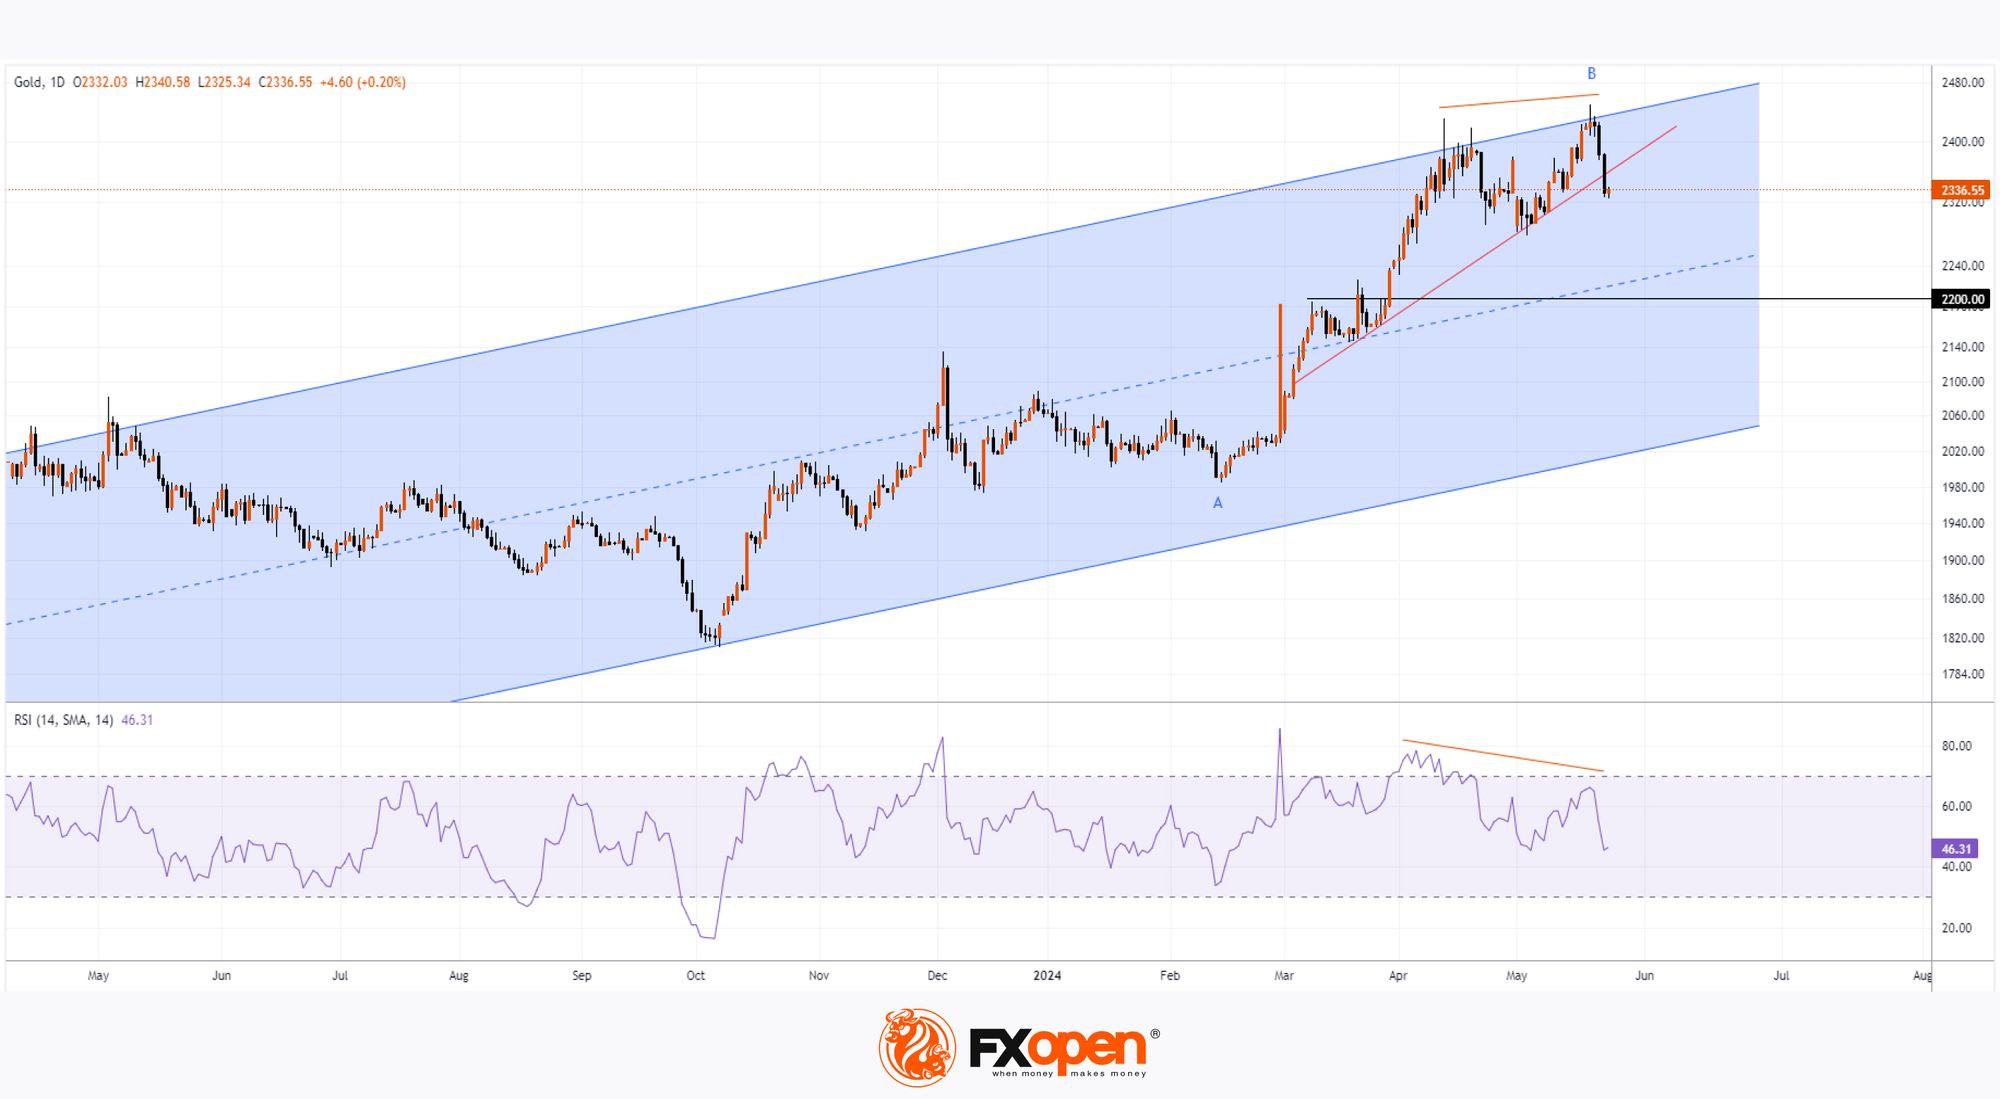
Technical analysis of the XAU/USD daily chart shows that:
→ The price of gold is in a long-term uptrend (shown in blue);
→ After reaching the upper boundary in mid-April, there was a pullback to around 2300 in early May.
Setting the historical record on May 20th also marked another achievement of the upper boundary of the channel. However:
→ Bulls failed to sustain the price above the mid-April peak;
→ There was a reversal from the upper boundary of the channel with the formation of bearish divergence on the RSI between the two peaks, which can be considered as a significant double top pattern, where the second top is slightly higher than the first.
Considering the speed of the gold price decline from the May 20th peak and the confidence of bears in breaking the trend line (shown in red), it is reasonable to assume that the market is vulnerable to forming a deeper correction within the ascending blue channel – it is possible that the correction will develop towards the median line of the blue channel.
It is worth noting the important support level at $2200:
→ This is a psychological level;
→ Previously, it served as resistance;
→ It is approximately at the 50% level of impulse A→B.
Start trading commodity CFDs with tight spreads (additional fees may apply). Open your trading account now or learn more about trading commodity CFDs with FXOpen.
This article represents the opinion of the Companies operating under the FXOpen brand only. It is not to be construed as an offer, solicitation, or recommendation with respect to products and services provided by the Companies operating under the FXOpen brand, nor is it to be considered financial advice.
Stay ahead of the market!
Subscribe now to our mailing list and receive the latest market news and insights delivered directly to your inbox.


Latest articles

Consolidation Ahead of NFP: Commodity Currencies Search for Direction
Commodity-linked currencies have entered a consolidation phase following recent directional moves, as market participants adopt a wait-and-see approach ahead of key US labour market data. Current price action reflects a balance between ongoing demand for the US dollar and attempts

The Real Driver Behind the Dollar Rally: Market Insights with Gary Thomson
The US dollar has been firm, but the drivers behind the move may be more complex than they first appear.
While geopolitical tension and shifts in risk sentiment play a role, current price behaviour seems increasingly influenced by inflation expectations

EUR/USD and USD/CHF Pull Back: Market Reacts to Fundamentals
European currencies have shown a recovery in recent trading sessions after their recent decline, displaying early signs of a reversal. The US dollar is weakening amid expectations surrounding upcoming US macroeconomic data, while market participants are reassessing their short-term positions