


FXOpen

According to confirmed information, Iranian President Ebrahim Raisi, considered a potential successor to the country's supreme leader, Ayatollah Ali Khamenei, died in a helicopter crash in a mountainous area near the border with Azerbaijan. The helicopter also carried Foreign Minister Hossein Amir-Abdollahian and other officials, all of whom perished.
As news of the helicopter search in the inaccessible mountainous region spread, the price of gold rose significantly. Yahoo Finance reports that the gold rally was driven by uncertainty about the situation in Iran.
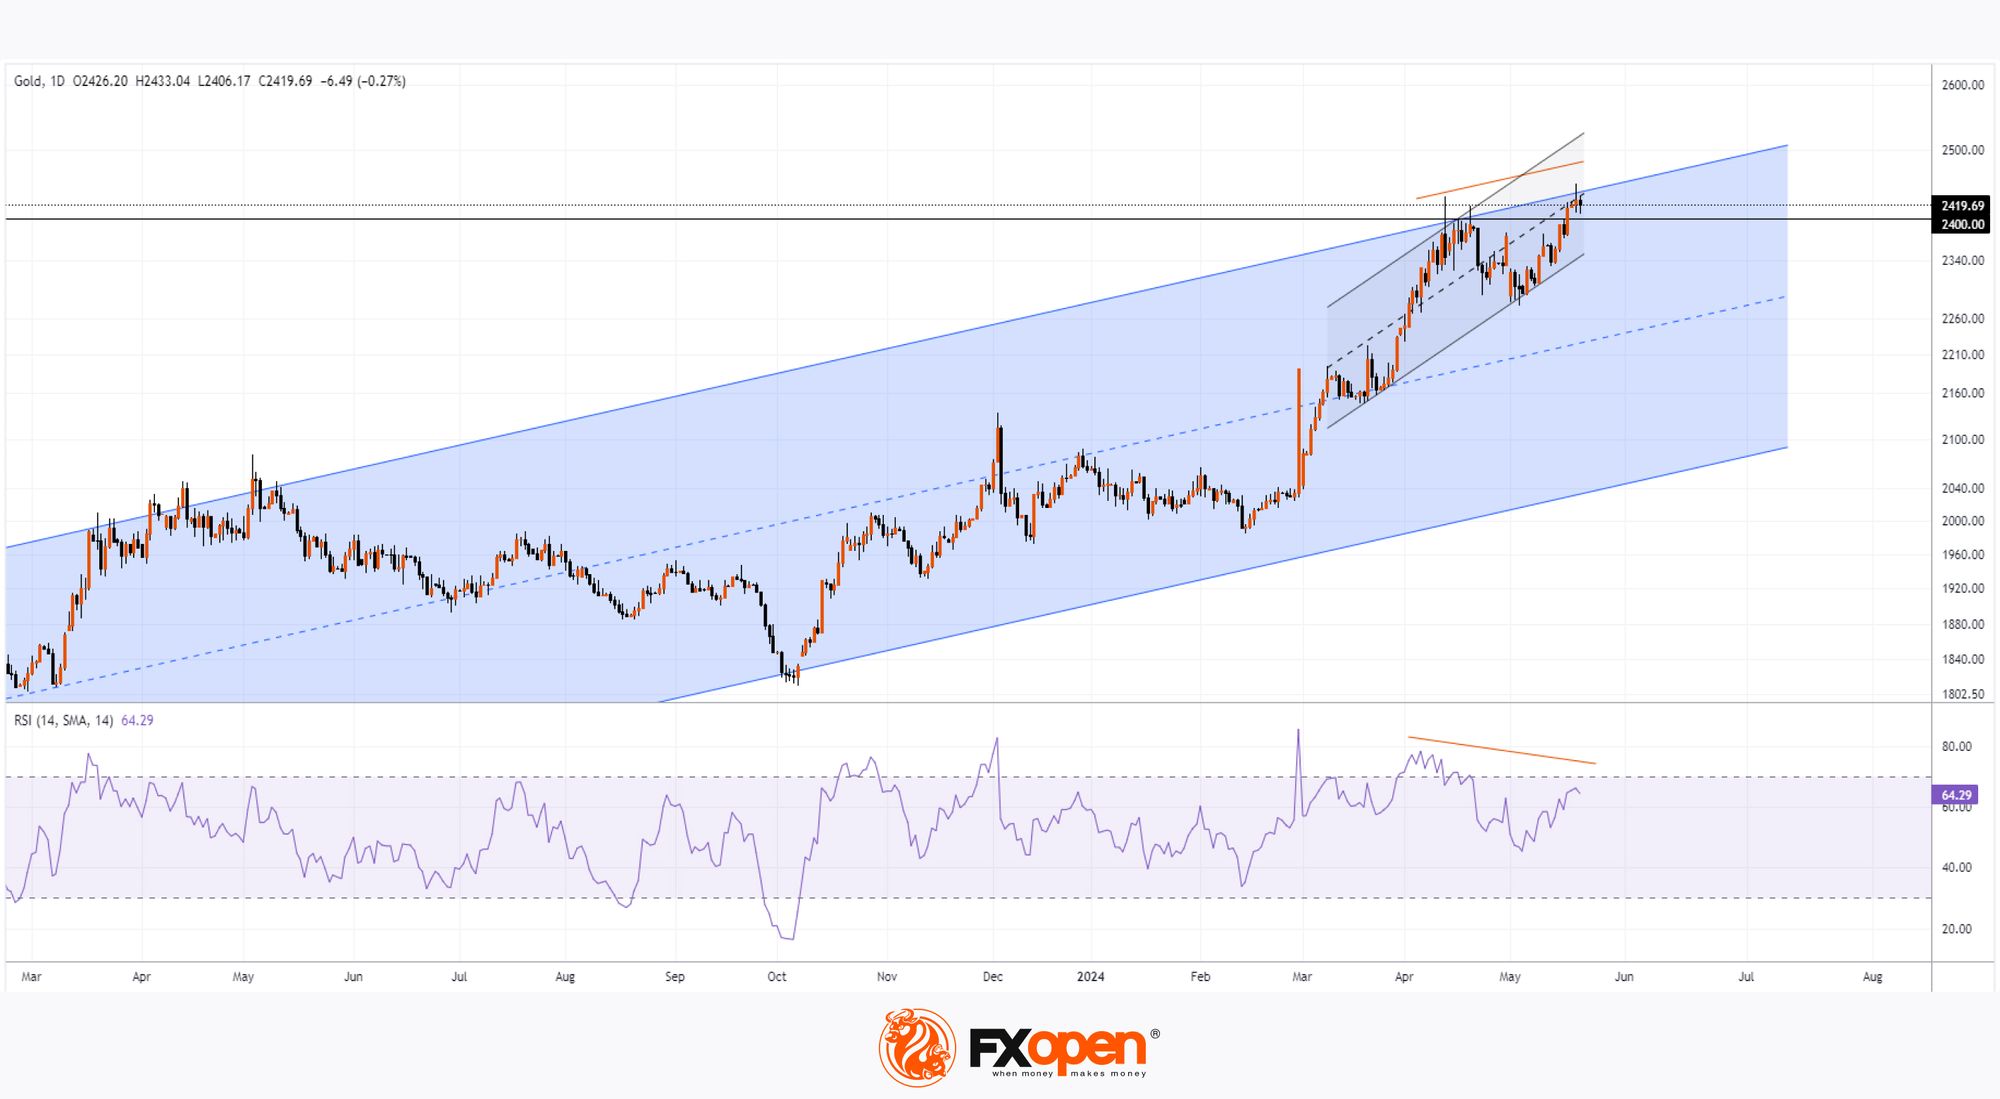
The XAU/USD chart indicates that yesterday, at the peak of the day, the price of gold reached $2450, an all-time high. Can the rally continue?
On 16 April, we wrote that the $2400 level could be a significant resistance – after which the price corrected to the $2380 level. In this context, today's gold price can be seen as a second attempt to break through the $2400 level.
Let's conduct a technical analysis of the gold price considering the new data:
→ The long-term ascending blue channel remains relevant. The price is near its upper boundary.
→ The price is near the median of the ascending black channel, which shows signs of resistance.
→ A bearish divergence is forming on the RSI indicator.
→ Having set a historical peak, the gold price started to decline. This was influenced by an official statement from Israel denying involvement in the crash.
It is possible that a reduction in geopolitical tension will deter bulls from pushing for new historical highs. Notably, the XBR/USD oil price did not show a similarly sharp rise, which would be expected if fears of Middle East escalation were truly strong.
Given the above, a new correction on the XAU/USD chart can be expected – possibly to the lower boundary of the short-term channel (shown in black). If this scenario unfolds, bears might find that the $2400 level now acts as significant support.
Start trading commodity CFDs with tight spreads (additional fees may apply). Open your trading account now or learn more about trading commodity CFDs with FXOpen.
This article represents the opinion of the Companies operating under the FXOpen brand only. It is not to be construed as an offer, solicitation, or recommendation with respect to products and services provided by the Companies operating under the FXOpen brand, nor is it to be considered financial advice.
Stay ahead of the market!
Subscribe now to our mailing list and receive the latest market news and insights delivered directly to your inbox.


Latest articles

Consolidation Ahead of NFP: Commodity Currencies Search for Direction
Commodity-linked currencies have entered a consolidation phase following recent directional moves, as market participants adopt a wait-and-see approach ahead of key US labour market data. Current price action reflects a balance between ongoing demand for the US dollar and attempts

The Real Driver Behind the Dollar Rally: Market Insights with Gary Thomson
The US dollar has been firm, but the drivers behind the move may be more complex than they first appear.
While geopolitical tension and shifts in risk sentiment play a role, current price behaviour seems increasingly influenced by inflation expectations

EUR/USD and USD/CHF Pull Back: Market Reacts to Fundamentals
European currencies have shown a recovery in recent trading sessions after their recent decline, displaying early signs of a reversal. The US dollar is weakening amid expectations surrounding upcoming US macroeconomic data, while market participants are reassessing their short-term positions