


Gold Price Recovers from Year Lows
FXOpen

On Wednesday, the gold price XAU/USD set a year low due to news about inflation in the US, which “does not want” to decline to target levels.
As a result, market participants are revising their estimates regarding the price of gold with the prospect that the Fed's tight policy may last for a longer time, as well as taking into account yesterday's news:
→ Retail Core Sales in the US fell by 0.6%, although an increase of +0.2% was expected, a month ago = +0.4%.
→ the number of unemployment applications for the week remains relatively stable: actual = 212k, a week ago = 218k, a month ago = 202k.
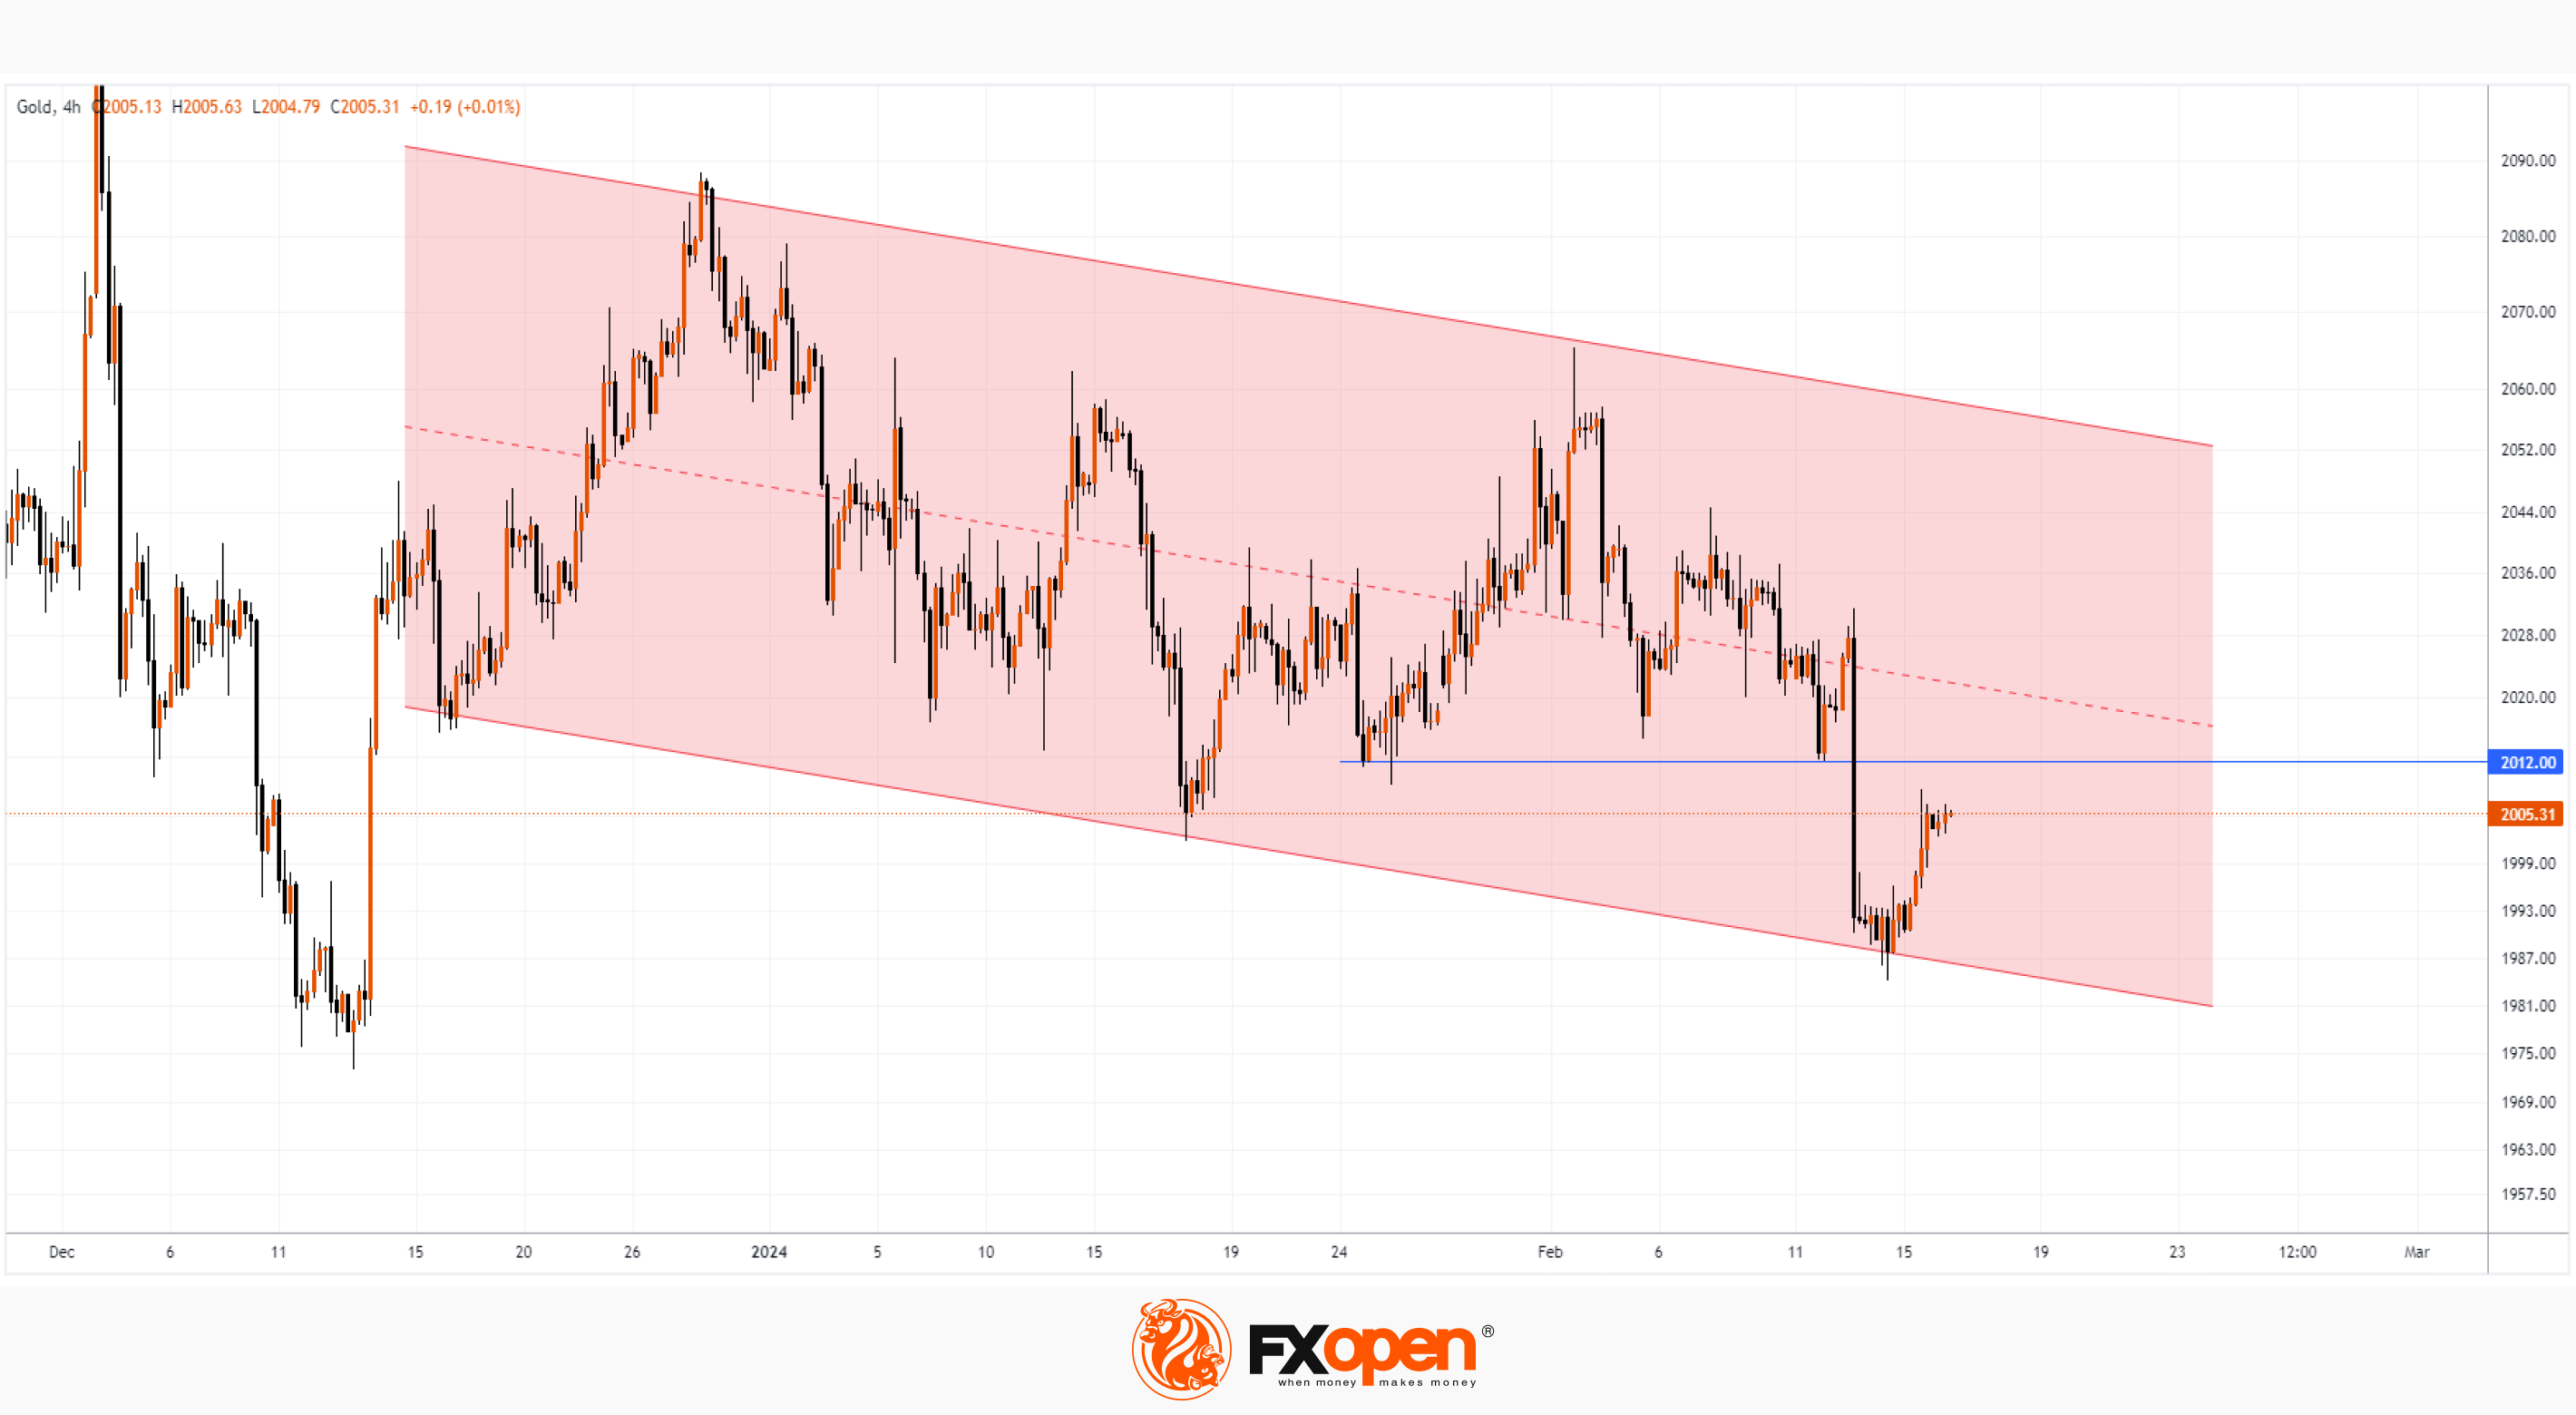
The XAU/USD chart shows that the price of gold is moving within a downward channel (shown in red). During the first half of February, the price managed to decline from its upper limit to its lower limit, which can be considered as evidence of the bears’ initiative. Then the current price recovery from the lower boundary may only be a correction from the oversold zone within the broader bear market.
Obstacles to the recovery of the XAU/USD price may include the following resistance levels:
→ median line of the descending channel;
→ the level of 2012 dollars per ounce, which worked as support, but was broken on Wednesday.
Reuters writes that the price of gold XAU/USD may reach the levels of 1960-1970 to intensify interest from buyers. This is a valid scenario that may well come true if the current trend in the form of a downward channel is not broken.
Start trading commodity CFDs with tight spreads (additional fees may apply). Open your trading account now or learn more about trading commodity CFDs with FXOpen.
This article represents the opinion of the Companies operating under the FXOpen brand only. It is not to be construed as an offer, solicitation, or recommendation with respect to products and services provided by the Companies operating under the FXOpen brand, nor is it to be considered financial advice.
Stay ahead of the market!
Subscribe now to our mailing list and receive the latest market news and insights delivered directly to your inbox.


Latest articles

AI Valuations Are Back in the Spotlight
Artificial intelligence remains the dominant investment theme of 2026, but investors are increasingly questioning whether AI stock valuations are keeping pace with reality.
💰 Big Tech continues to invest at an unprecedented scale, with hyperscaler AI spending projected to exceed $800

AUD/CAD: Months of Indecision — Is a Breakout Finally Coming?
The Australian dollar has clawed back most of its end-of-June losses, when it touched three-month lows against the greenback amid escalating Middle East tensions. Since then, sentiment has improved: the RBA's Assistant Governor Sarah Hunter signalled the board stands ready

USD/JPY: Battling at the Top of the Triangle
On 3 July, Japan's Finance Minister, Satsuki Katayama, stated that the Ministry of Finance remains in close contact with US authorities regarding developments in USD/JPY as the yen traded near its weakest level in almost 40 years. Similar verbal