


FXOpen

The XAU/USD gold chart today indicates that the price of the metal has exceeded USD 2,250 per ounce.
Causes:
→ Geopolitical tensions. Military conflicts in Ukraine and the Middle East do not subside, the threat of terrorist attacks is growing, and new hot spots may appear on the world map.
→ Concerns about a new round of inflation due to rising commodity prices.
In both cases, gold acts as a safe-haven asset.
Since the beginning of 2024, the price of XAU/USD has risen by 12%. How much longer can the rally last?
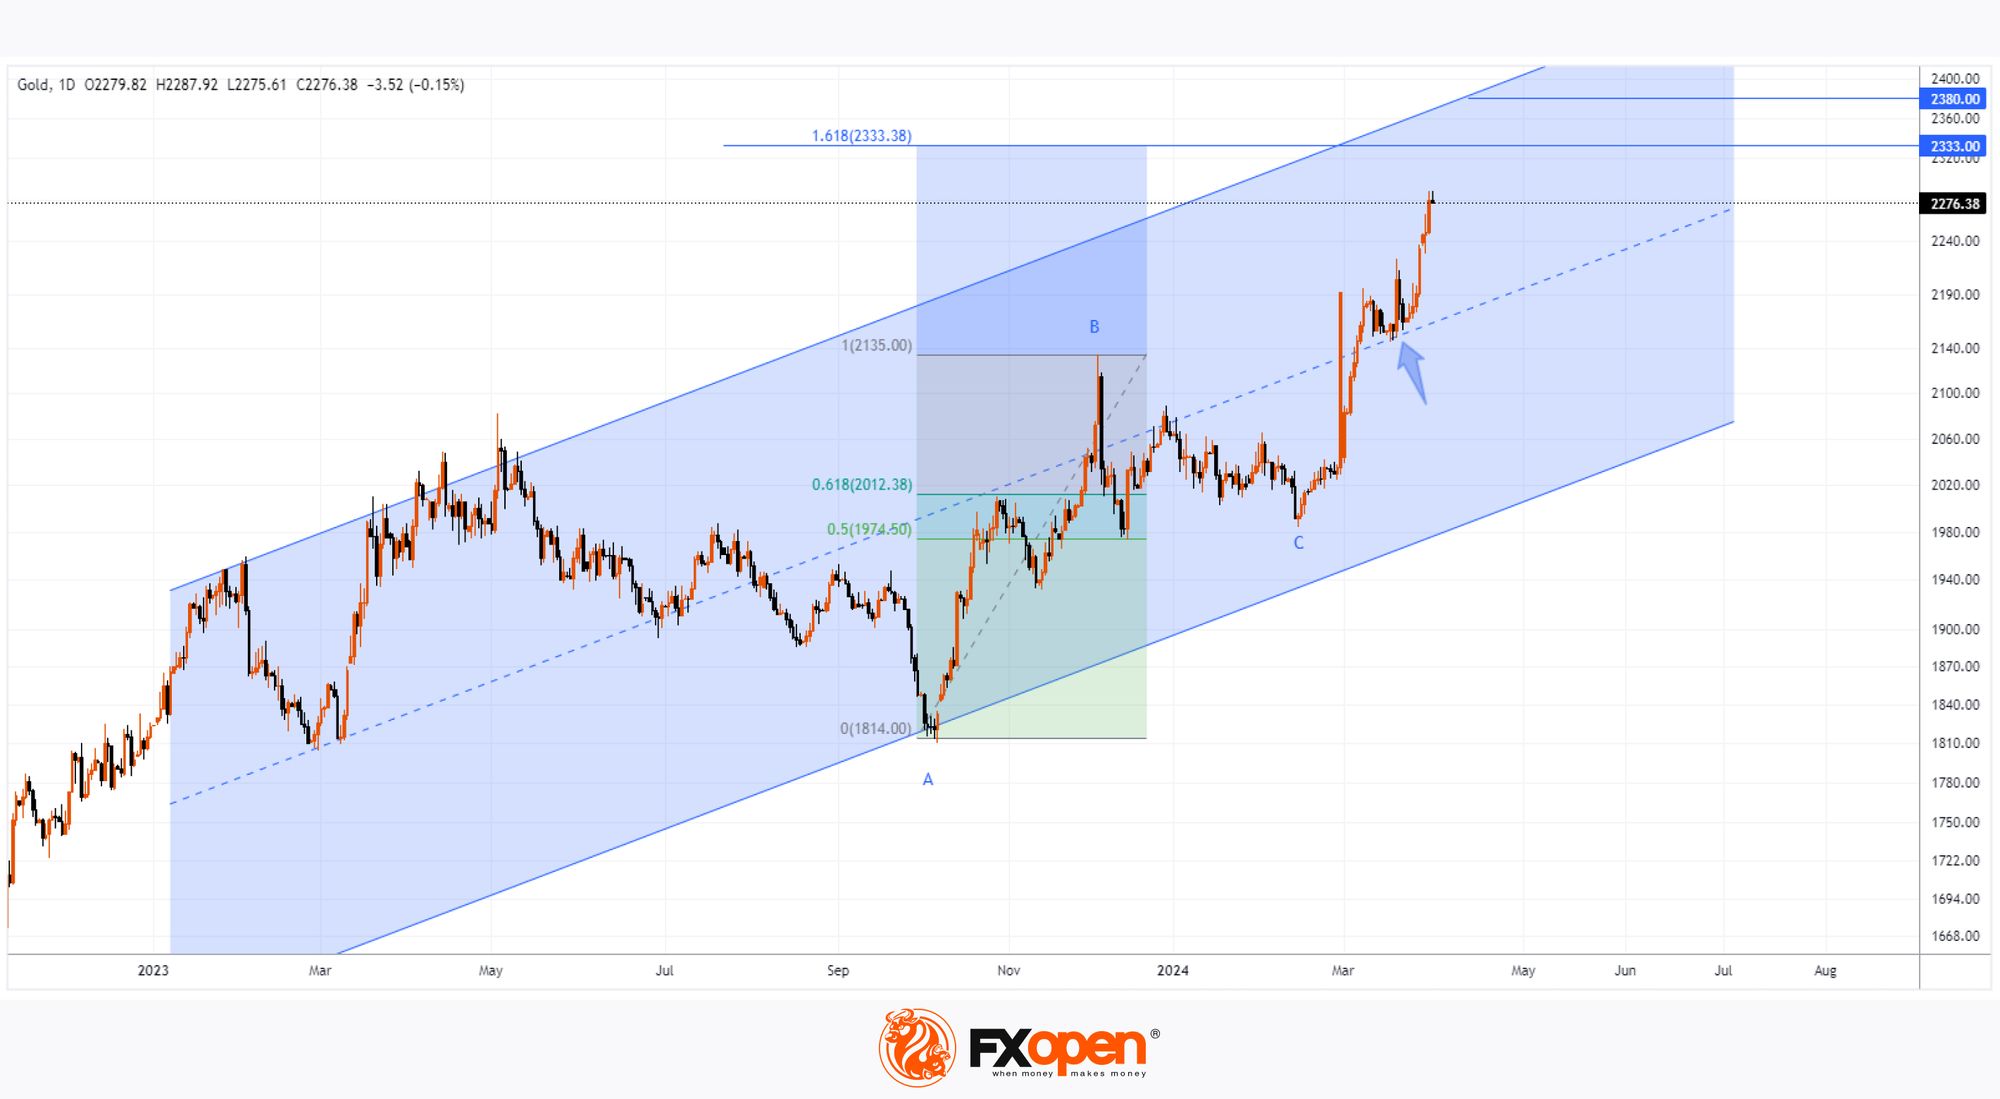
In terms of technical analysis of the gold price, there are two tools to take into account:
→ ascending channel (shown in blue). Today XAU/USD is in its upper half, the price has tested (shown by the arrow) the support of the median line. And from the first days of April it has been demonstrating dynamics that direct it towards the upper border of the channel.
→ Fibonacci proportions. If we take the A→B impulse as 100%, then the decrease in B→C finds support in the zone of levels 0.5-0.618, which confirms the relevance of using proportions. Then the target for impulse price growth from point C may be the level of 1.618.
Thus, these technical analysis tools for the XAU/USD chart indicate that the price of gold may rise to the 2,333-2,380 zone if the current bullish sentiment continues.
Start trading commodity CFDs with tight spreads (additional fees may apply). Open your trading account now or learn more about trading commodity CFDs with FXOpen.
This article represents the opinion of the Companies operating under the FXOpen brand only. It is not to be construed as an offer, solicitation, or recommendation with respect to products and services provided by the Companies operating under the FXOpen brand, nor is it to be considered financial advice.
Stay ahead of the market!
Subscribe now to our mailing list and receive the latest market news and insights delivered directly to your inbox.


Latest articles

Market Insights with Gary Thomson: Where Are Oil, Gas & Global Indices Heading?
In this video, we’ll explore the key economic events and market trends, shaping the financial landscape. Get ready for insights into financial markets to help you navigate the week ahead. Let’s dive in!
In this episode of Market

Netflix (NFLX) Shares Pull Back After a 30% Surge
On 21 January, while analysing the NFLX chart, we:
→ identified a descending channel and a resistance zone around the $100 level;
→ noted that Netflix shares were showing a sustained downtrend. Selling pressure had been triggered primarily by reports of a

US Dollar Index (DXY) Rises Above the 100 Level
Today the US Dollar Index (DXY) climbed above the psychological 100 mark for the first time in 2026, supported by a tense fundamental backdrop, with the military conflict in the Middle East acting as the main driver.
→ Financial market participants