


Gold Prices Recover After a Catastrophic Sell-Off
FXOpen

Yesterday, while analysing the silver price chart, we described a fundamental shift in supply and demand dynamics that likely became the key driver behind the sharp decline in prices.
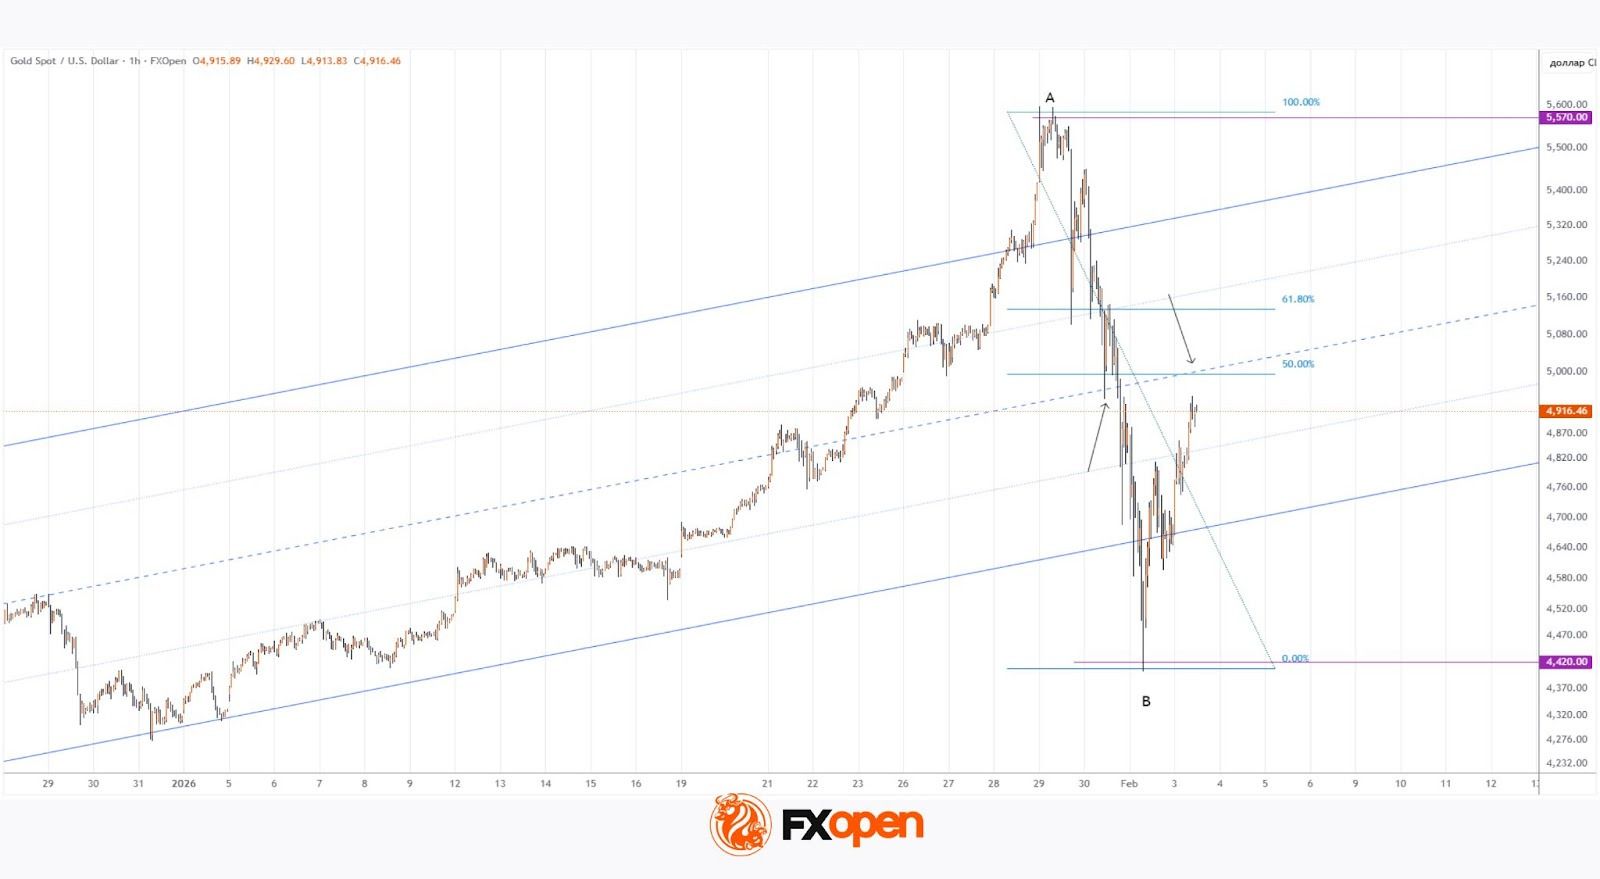
This same reasoning can likely be applied to the gold market, which experienced a synchronous and dramatic sell-off. From the A peak on 29 January near $5,570, the gold price (XAU/USD) collapsed to the B low on 2 February below $4,420 — a drop of around 20%:
→ “Smart money” locked in profits on long positions and switched to selling at market;
→ retail speculators were forced to close long positions at a loss, while the liquidation of previously leveraged trades accelerated the cascading decline.
On 26 January, when analysing gold price movements, we:
→ highlighted that the market was extremely overbought;
→ noted, however, that abandoning bullish expectations prematurely would be inappropriate without a major catalyst.
It now appears that the A→B collapse may have been precisely such an event.
Technical Analysis of the XAU/USD Chart
The previously identified channel was extended upwards by the abnormal surge in XAU/USD prices. Within this structure:
→ the A peak formed in overbought territory above the upper boundary of the channel;
→ the B low developed in oversold territory below its lower boundary;
→ during the sell-off on 30 January, the channel median briefly acted as support (as indicated by the arrow).
It is therefore reasonable to assume that the current rebound from extreme oversold conditions may encounter resistance formed by:
→ the median of the channel;
→ key Fibonacci retracement levels (50% and 61.8%).
Looking several weeks ahead, it is possible that XAU/USD may stabilise in the lower half of this channel. At the same time, the long-term outlook remains constructive: JPMorgan analysts have raised their year-end gold price forecast to $6,300 per ounce, while Deutsche Bank expects gold to reach $6,000 per ounce.
Start trading commodity CFDs with tight spreads (additional fees may apply). Open your trading account now or learn more about trading commodity CFDs with FXOpen.
This article represents the opinion of the Companies operating under the FXOpen brand only. It is not to be construed as an offer, solicitation, or recommendation with respect to products and services provided by the Companies operating under the FXOpen brand, nor is it to be considered financial advice.
Stay ahead of the market!
Subscribe now to our mailing list and receive the latest market news and insights delivered directly to your inbox.


Latest articles

Market Analysis: GBP/USD Holds Firm, USD/CAD Bulls Target Breakout Move
GBP/USD started a downside correction from 1.3480. USD/CAD is gaining bullish momentum and might clear 1.3880 for more upside.
Important Takeaways for GBP/USD and USD/CAD Analysis Today
· The British Pound rallied toward 1.3500


Market Repricing of Risk as Gold Loses Safe-Haven Demand
Geopolitical tensions in the Middle East had remained the primary macro driver for the gold market over recent weeks; however, on 8 April the situation shifted sharply as the United States and Iran agreed to a temporary two-week ceasefire, including