


Hang Seng Index Analysis: Minimum of the Year, But Not Everything Is So Bad
FXOpen
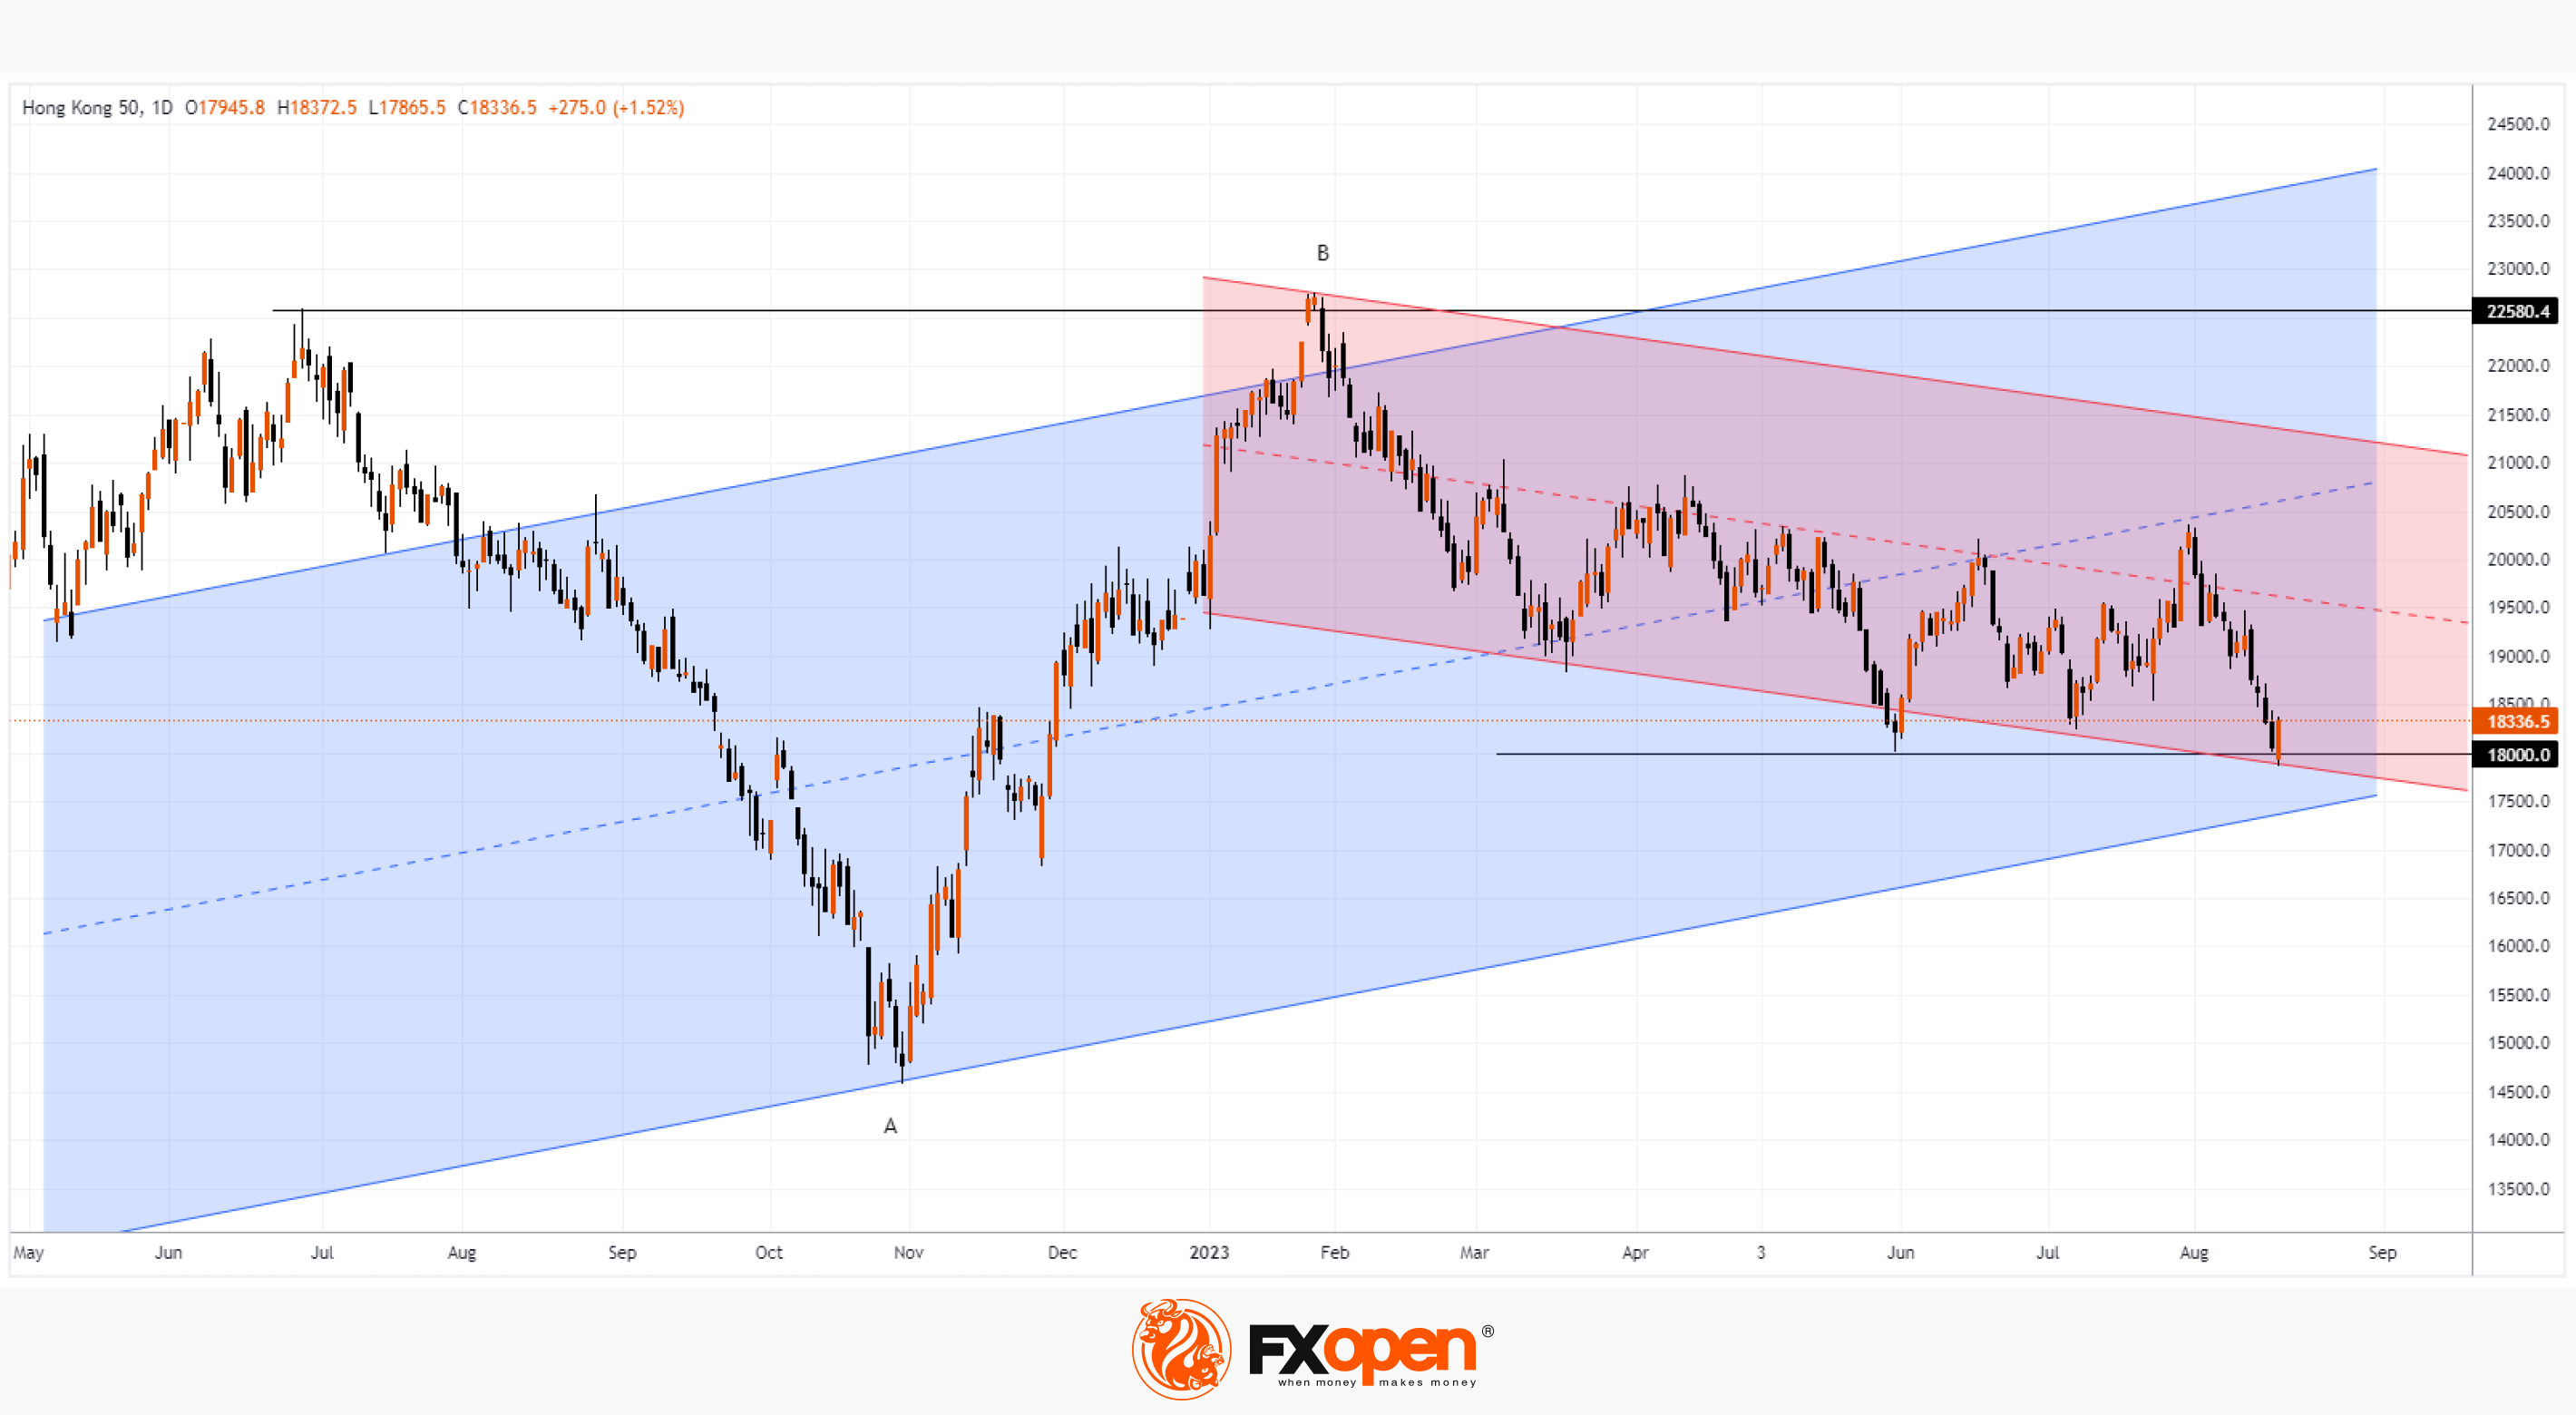
Today, the price of the Hang Seng index fell below the level of 18,000 for the first time since November 2022. The media is publishing materials about the slowdown in the Chinese economy (which is confirmed by statistics) and the lack of expected government stimulus.
The FT writes that foreign investors have canceled purchases of Chinese shares worth USD 7.4 billion, which were made following a July 24 pledge by the Chinese Communist Party Politburo to increase support for the economy. And according to data released by the Chinese currency regulator on Wednesday, the volume of bonds of foreign institutional investors fell by USD 5 billion in July.
However, not everything is so bad.
Bullish arguments:
→ The price of the Hang Seng index rose rapidly after breaking through the psychological level at 18,000.
→ Also, at the close of today's candlestick, a false bearish breakdown of the previous low of the year, recorded on the last day of May, may form. Pay attention to the false bullish breakdown at the end of January — perhaps a mirror image situation is happening.
→ The price is near the lower line of the ascending channel, shown in blue (which is not quite obvious yet).
→ The price is near the lower line of the descending channel shown in red.
→ The price is near the level of 50% of the increase in A→B.
If the price of the Hang Seng index rises from a block of listed supports, this will be another example of how market lows are accompanied by negative media.
Trade global index CFDs with zero commission and tight spreads (additional fees may apply). Open your FXOpen account now or learn more about trading index CFDs with FXOpen.
This article represents the opinion of the Companies operating under the FXOpen brand only. It is not to be construed as an offer, solicitation, or recommendation with respect to products and services provided by the Companies operating under the FXOpen brand, nor is it to be considered financial advice.
Stay ahead of the market!
Subscribe now to our mailing list and receive the latest market news and insights delivered directly to your inbox.


Latest articles

Weekly Market Insights with Gary Thomson: The Week of Central Banks and Earnings
In this video, we’ll explore the key economic events and market trends, shaping the financial landscape. Get ready for insights into financial markets to help you navigate the week ahead. Let’s dive in!
In this episode of Market

Intel at a Crossroads: Earnings Beat Meets Technical Resistance
Intel has just delivered its strongest quarter in over fifteen years, and the market reaction says it all. Q2 2026 revenue surged 25% year-over-year to $16.1 billion, crushing the consensus estimate of $14.42 billion, while adjusted EPS of

Tesla: Complex Range Structure Breaks Down Following Quarterly Earnings
Tesla released its Q2 2026 results after the market closed on 22 July. Revenue increased 26% year-on-year to $28.24 billion, while vehicle deliveries reached a record 480,126 units. However, operating margin fell sharply to 1.4%, down from