


FXOpen
While today the world’s first economy is celebrating Labor Day (so due to the bank holiday in the US, financial markets will most likely have below average volatility), the second world’s economy is recovering. From the low of the year reached on August 22, the Hang Seng index has already risen by more than 6%, as we suggested in the post on August 17th.
The point is to stimulate the Chinese economy by the authorities with special support for the real estate sector. So, in August:
→ the Ministry of Finance introduced tax incentives for small businesses and rural households;
→ the People's Bank of China lowered the base annual rate on loans;
→ the State Council approved housing planning and construction guidelines;
→ citizens were allowed to take soft loans to buy their first home, regardless of their credit history. Other restrictions are also planned to be lifted.
For sure, September will bring more news about stimulating the Chinese economy, and the chart shows the optimism of market participants:
→ The price of the index rose briefly below the psychological level of 18,000.
→ The price of the index has returned to the ascending channel shown in blue.
→ The price is near the lower line of the descending channel shown in red.
→ The price worked out the level of 50% of the growth A→B.
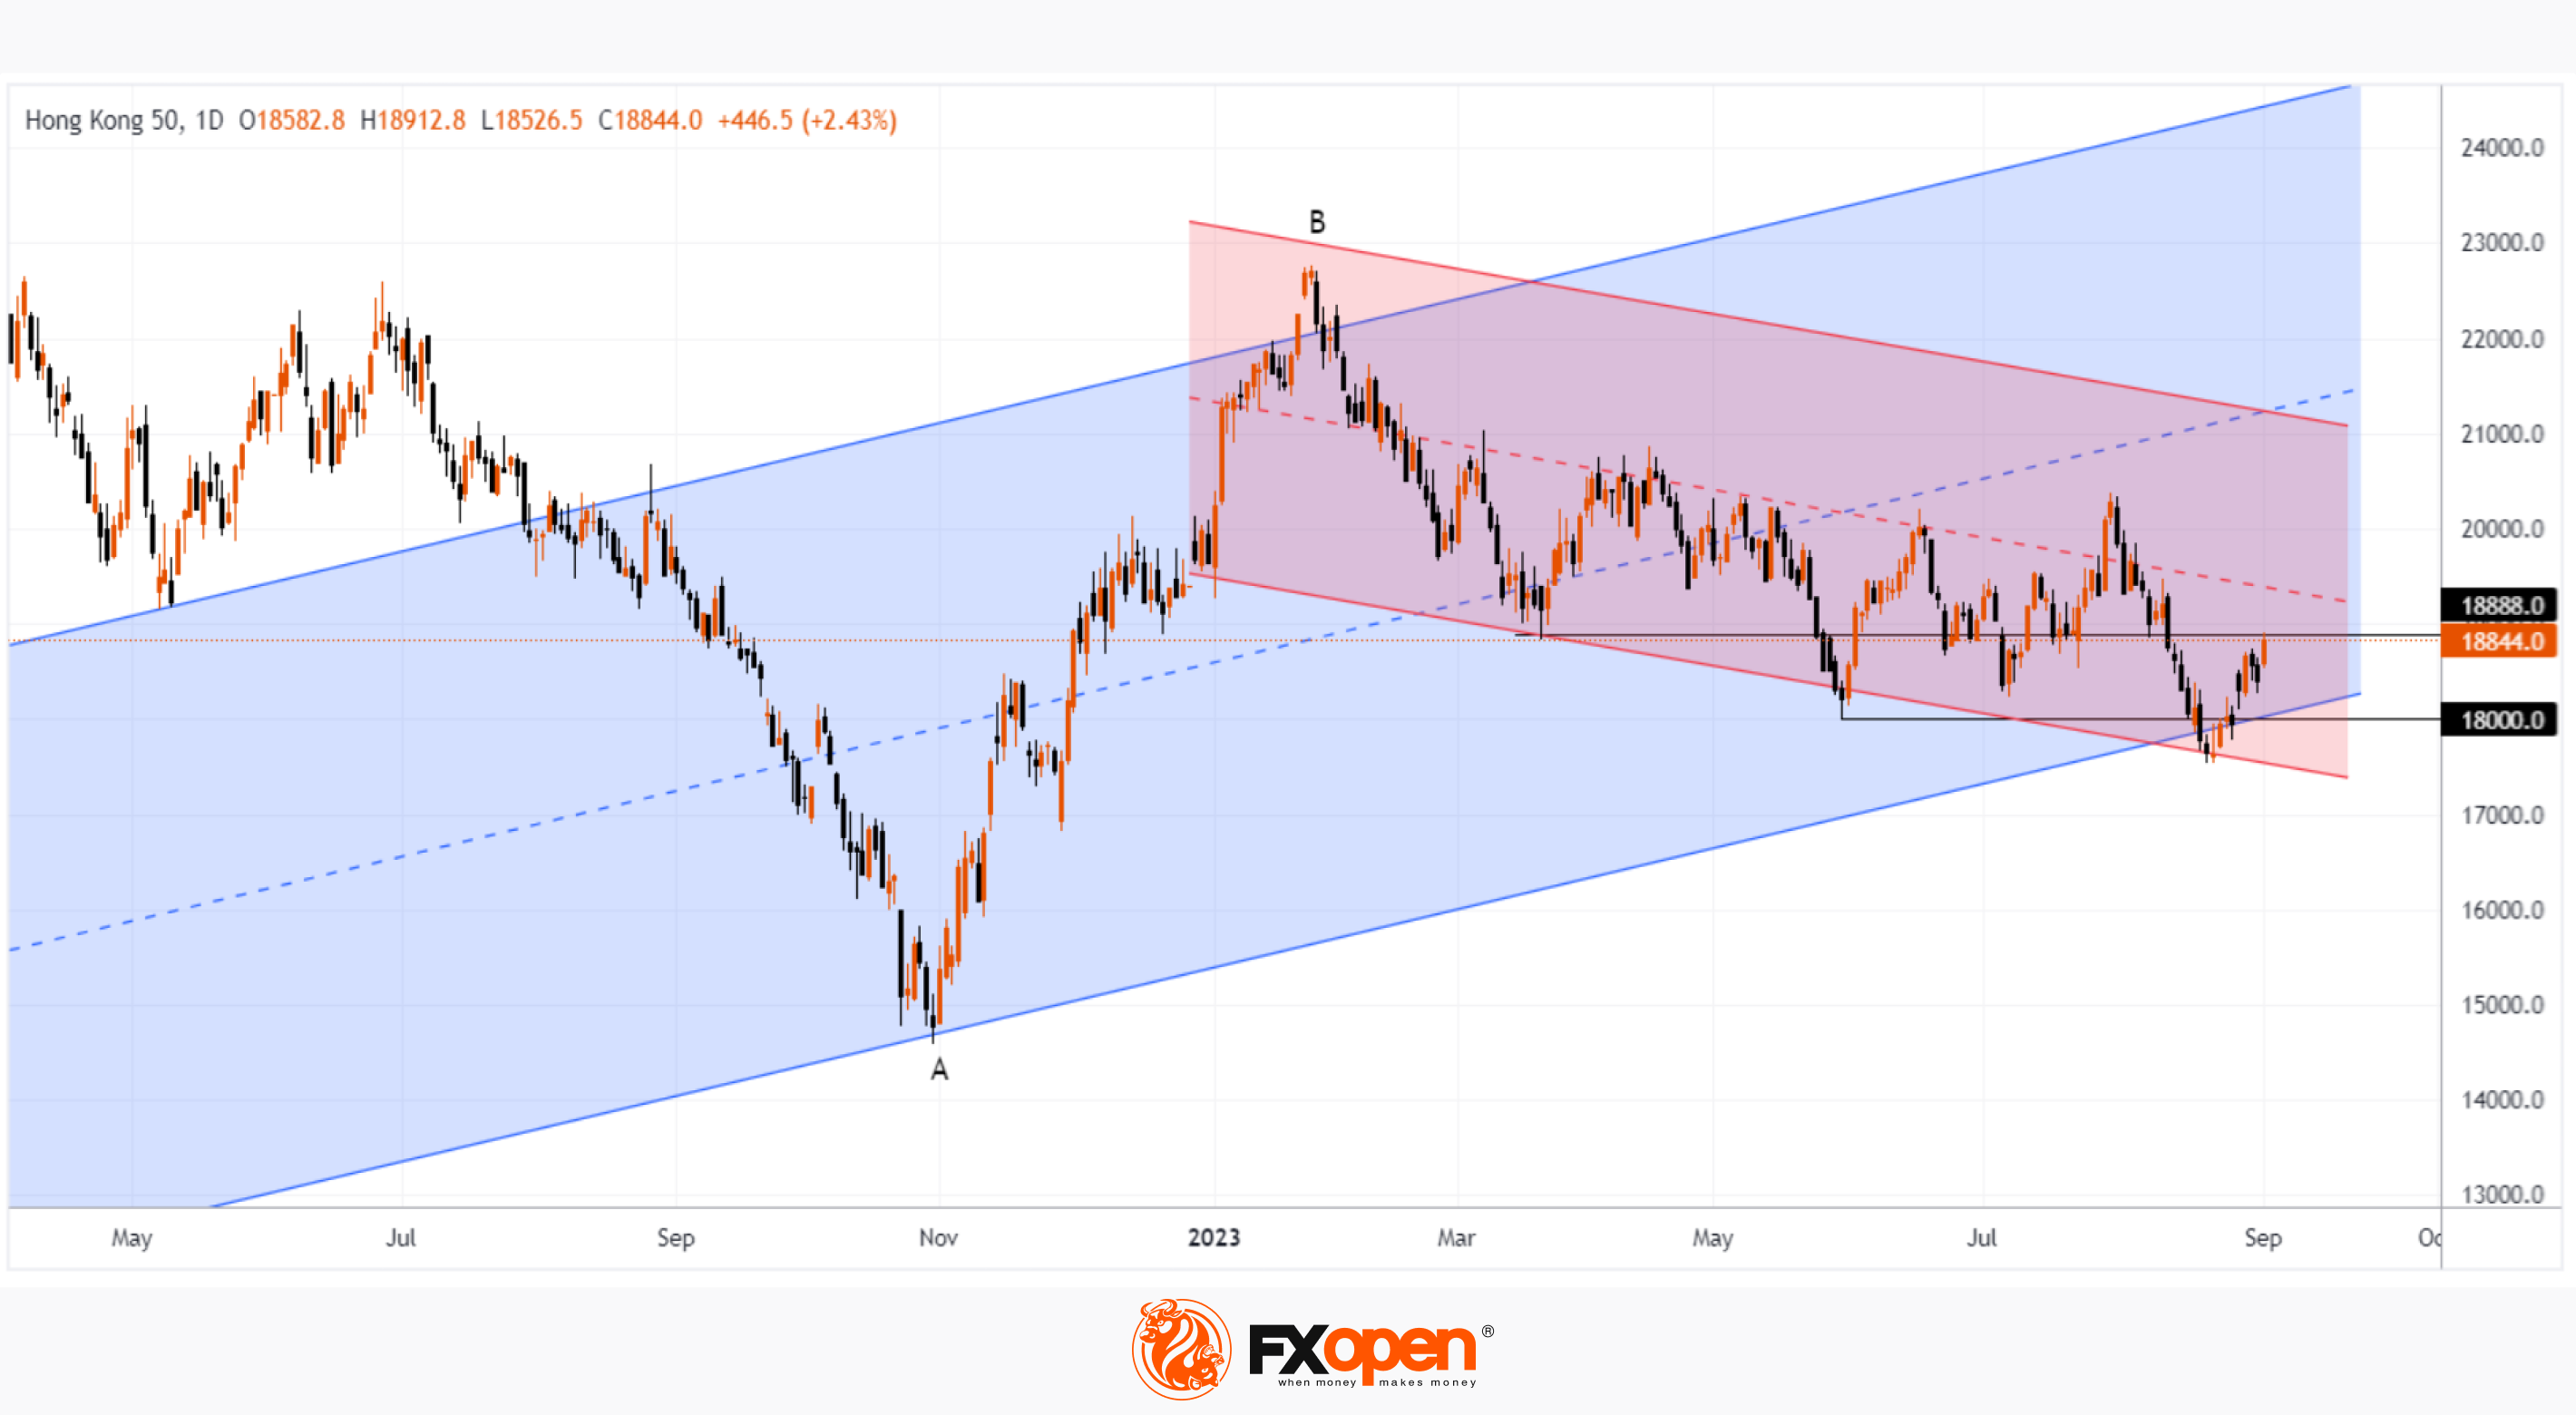
However, the bears may show their presence in the near future, as the price is near the level of 18,888, which has influenced it more than once in the summer. Also, the market may feel resistance from the median line of the channel shown in red.
Trade global index CFDs with zero commission and tight spreads. Open your FXOpen account now or learn more about trading index CFDs with FXOpen.
This article represents the opinion of the Companies operating under the FXOpen brand only. It is not to be construed as an offer, solicitation, or recommendation with respect to products and services provided by the Companies operating under the FXOpen brand, nor is it to be considered financial advice.
Stay ahead of the market!
Subscribe now to our mailing list and receive the latest market news and insights delivered directly to your inbox.

Latest articles

Weekly Market Wrap With Gary Thomson: Nasdaq, EUR/USD, USD/CHF, Brent Crude Oil, Googl Shares
Get the latest scoop on the week's hottest headlines, all in one convenient video. Join Gary Thomson, the COO of FXOpen UK, as he breaks down the most significant news reports and shares his expert insights.
- Nasdaq Composite: Worst Session

Analysis of AUD/USD: Exchange Rate Falls to Early May Low
As indicated by the 4-hour AUD/USD chart today:
→ the rate fell below 0.652, a level last seen on May 2;
→ the RSI indicator dropped below 15, a level last seen during the panic over the spread of COVID-19

Analysis of AMZN Stock: Price at 1.5-Month Low
As shown in the AMZN chart, the stock price dropped below:
→ the psychological level of $180;
→ the mid-June interim low.
The last time AMZN traded below $180 was in early June.
Thus, AMZN has faced sell-offs, similar to other tech