


Inflation Data Changes Market Sentiment
FXOpen
US CPI data published yesterday did not meet expectations. Analysts predicted 3.2%, but in fact it turned out = 3.4% (value a month ago = 3.1%). This hardly means a reversal of the large-scale trend toward weakening inflation (a year ago CPI = 6.5%), but to some extent investors have become wary. According to FedWatch, expectations for a rate cut by the Federal Reserve in March dropped to about 65% (before the news was about 70%).
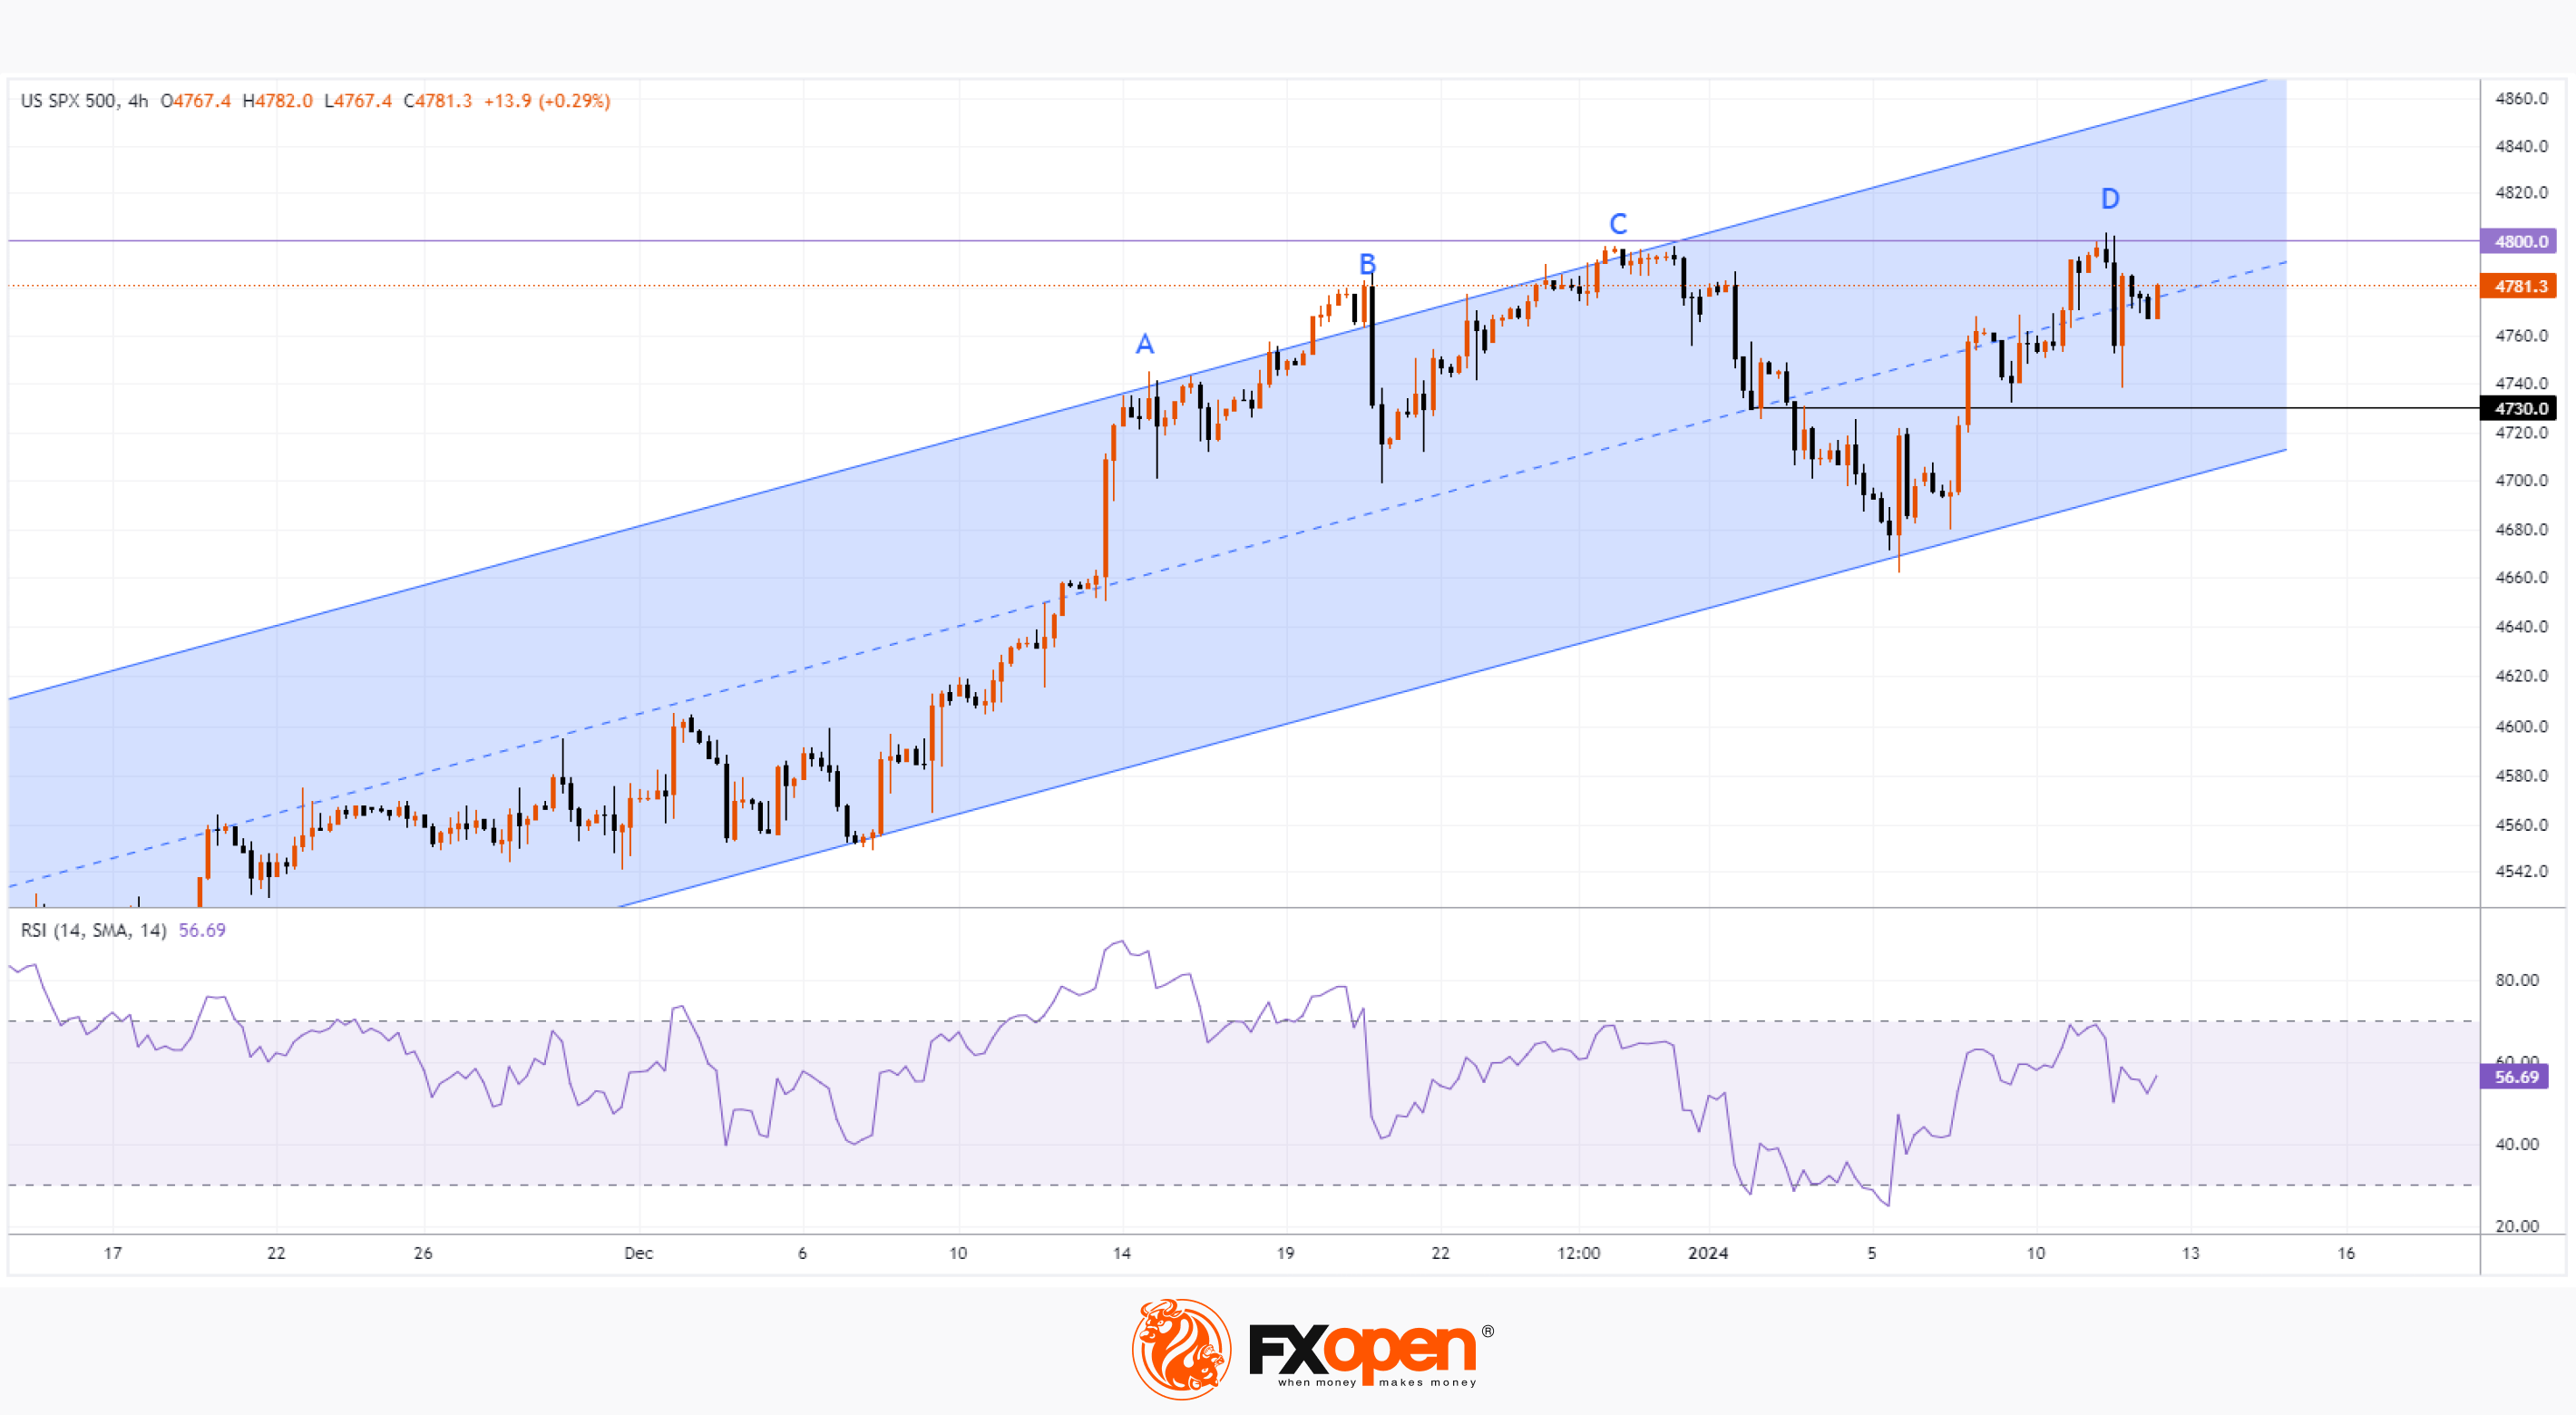
The publication of the news caused a noticeable surge in volatility in financial markets. Let's pay attention to the S&P 500 chart. The index price is within an uptrend (as shown by the blue channel), however, this trend may change:
→ Tops A-B-C form divergence with the RSI indicator — a sign of weakening demand near the upper border of the channel.
→ Yesterday, the price only slightly and briefly exceeded the A-B-C formation, forming top D. That is, a false bullish breakout was formed. This type of price behavior at top D confirms the activity of the bears at the level of 4,800.
Formally, the upward trend is still in force, but 4,800 may become an important test of the bulls’ perseverance. One marker could be today's PPI data (to be published at 16:30 GMT+3), as well as reaction to earnings reports from major banks, including JPMorgan Chase, Citigroup, Bank of America and Wells Fargo.
If they turn out to be disappointing, it is possible that the S&P 500 may fall to the lower border of the ascending channel.
Trade global index CFDs with zero commission and tight spreads (additional fees may apply). Open your FXOpen account now or learn more about trading index CFDs with FXOpen.
This article represents the opinion of the Companies operating under the FXOpen brand only. It is not to be construed as an offer, solicitation, or recommendation with respect to products and services provided by the Companies operating under the FXOpen brand, nor is it to be considered financial advice.
Stay ahead of the market!
Subscribe now to our mailing list and receive the latest market news and insights delivered directly to your inbox.


Latest articles

AI Valuations Are Back in the Spotlight
Artificial intelligence remains the dominant investment theme of 2026, but investors are increasingly questioning whether AI stock valuations are keeping pace with reality.
💰 Big Tech continues to invest at an unprecedented scale, with hyperscaler AI spending projected to exceed $800

AUD/CAD: Months of Indecision — Is a Breakout Finally Coming?
The Australian dollar has clawed back most of its end-of-June losses, when it touched three-month lows against the greenback amid escalating Middle East tensions. Since then, sentiment has improved: the RBA's Assistant Governor Sarah Hunter signalled the board stands ready

USD/JPY: Battling at the Top of the Triangle
On 3 July, Japan's Finance Minister, Satsuki Katayama, stated that the Ministry of Finance remains in close contact with US authorities regarding developments in USD/JPY as the yen traded near its weakest level in almost 40 years. Similar verbal