


Market Analysis: Bitcoin Updates Its Maximum for the Year
FXOpen

The cryptocurrency market showed a correlation with the stock market, gaining bullish momentum amid softening rhetoric from the Federal Reserve.
The price of the main cryptocurrency reached USD 35,900 for the first time in 18 months.
Wherein:
→ the positivity is also due to expectations that the US Securities and Exchange Commission will approve a Bitcoin ETF. According to analysts at Bernstein (an asset management firm), this could happen by the first quarter of 2024.
→ according to the same analysts, the price of Bitcoin could reach USD 150k by 2025;
→ Jurrien Timmer, director of global macroeconomics at Fidelity, called bitcoin a commodity currency or exponential gold that aims to be a store of value and a hedge against monetary depreciation.
Are the bullish sentiments that strong?
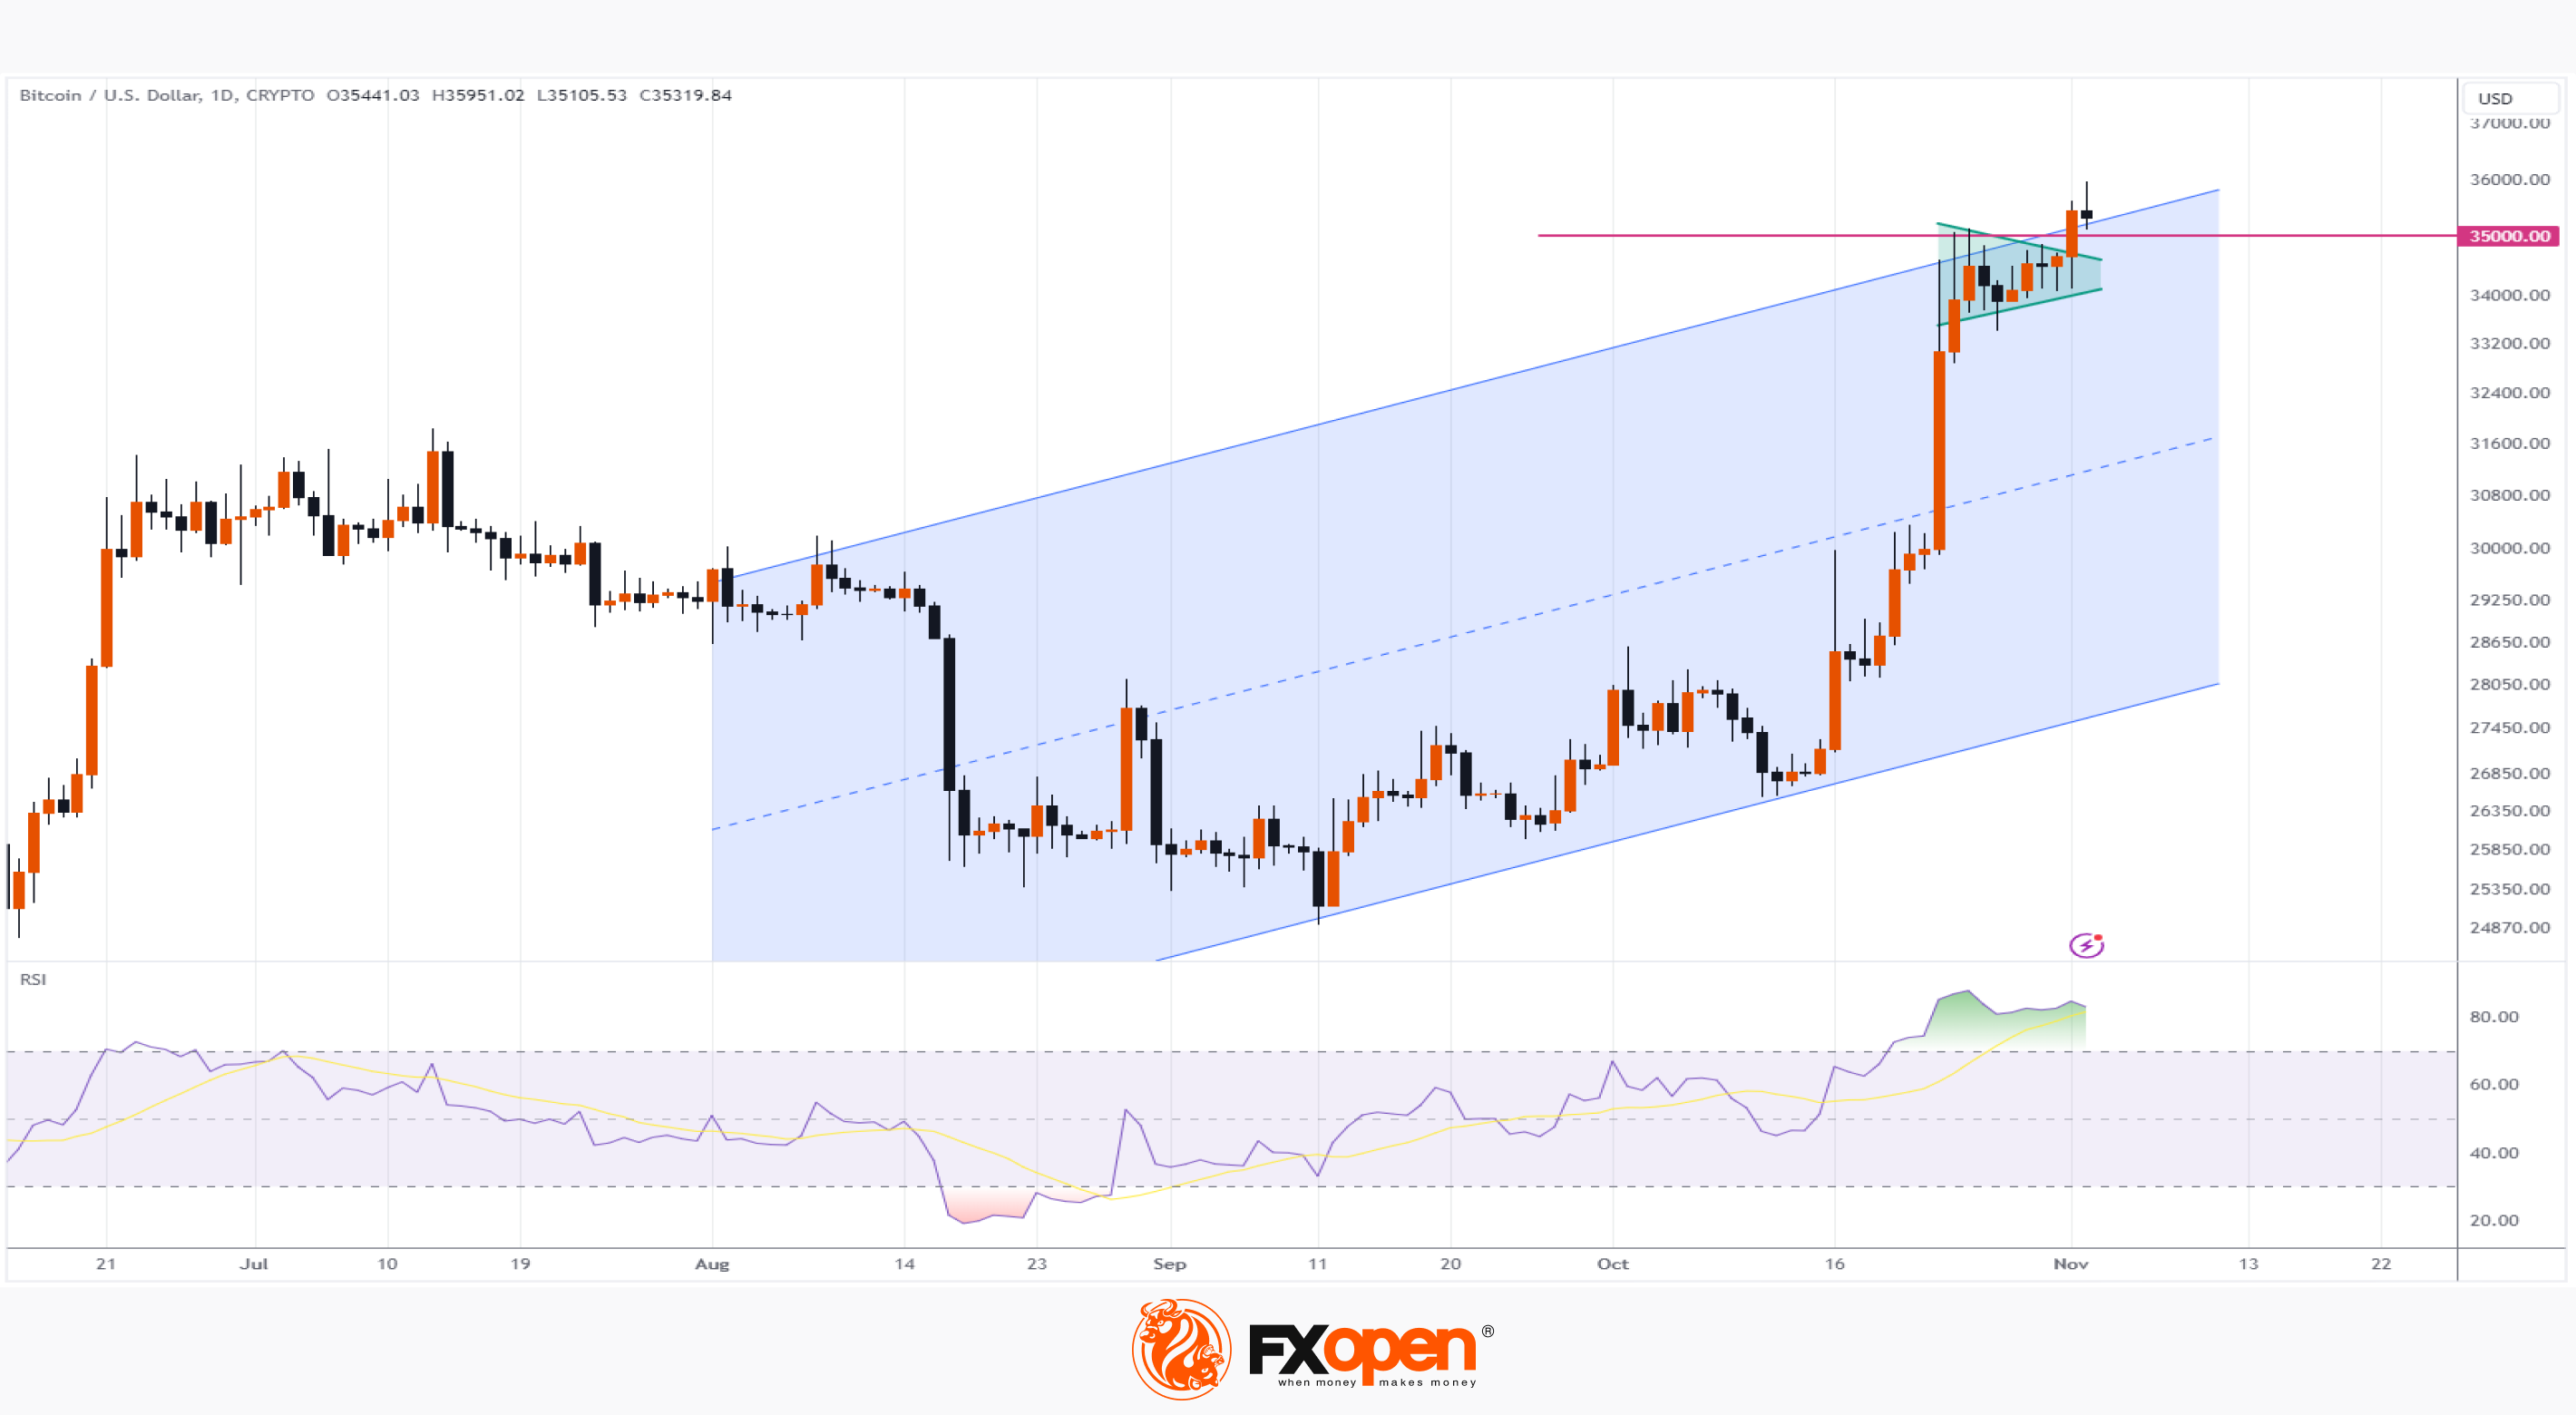
The chart provides information to help maintain an unbiased view of the market:
→ the price of BTC/USD is slightly above the upper border of the ascending channel. And this is a sign of overbought;
→ the price dynamics of BTC/USD forms a divergence with the RSI indicator, which is also in the overbought zone — which ultimately indicates the market’s vulnerability to a rollback;
→ the price is above the psychological level of 35,000 – and an analysis of the past behavior of the bitcoin price relative to round levels shows that false punctures are a common practice;
→ BTC/USD price has moved out of the consolidation zone (shown by the green triangle), but a breakout of the consolidation zone could be followed by a ton of buyers — and it is possible that they will find themselves locked in losses if a pullback does occur. A price return to the green triangle area will motivate them to close positions, thereby exerting even more selling pressure.
While ETF approval seems imminent and could attract significant capital to the bitcoin market over the long term, technically, the BTC/USD price could pull back from overbought territory.
FXOpen offers the world's most popular cryptocurrency CFDs*, including Bitcoin and Ethereum. Floating spreads, 1:2 leverage — at your service (additional fees may apply). Open your trading account now or learn more about crypto CFD trading with FXOpen.
*Important: At FXOpen UK, Cryptocurrency trading via CFDs is only available to our Professional clients. They are not available for trading by Retail clients. To find out more information about how this may affect you, please get in touch with our team.
This article represents the opinion of the Companies operating under the FXOpen brand only. It is not to be construed as an offer, solicitation, or recommendation with respect to products and services provided by the Companies operating under the FXOpen brand, nor is it to be considered financial advice.
Stay ahead of the market!
Subscribe now to our mailing list and receive the latest market news and insights delivered directly to your inbox.


Latest articles

AI Valuations Are Back in the Spotlight
Artificial intelligence remains the dominant investment theme of 2026, but investors are increasingly questioning whether AI stock valuations are keeping pace with reality.
💰 Big Tech continues to invest at an unprecedented scale, with hyperscaler AI spending projected to exceed $800

AUD/CAD: Months of Indecision — Is a Breakout Finally Coming?
The Australian dollar has clawed back most of its end-of-June losses, when it touched three-month lows against the greenback amid escalating Middle East tensions. Since then, sentiment has improved: the RBA's Assistant Governor Sarah Hunter signalled the board stands ready

USD/JPY: Battling at the Top of the Triangle
On 3 July, Japan's Finance Minister, Satsuki Katayama, stated that the Ministry of Finance remains in close contact with US authorities regarding developments in USD/JPY as the yen traded near its weakest level in almost 40 years. Similar verbal