


FXOpen
Job openings rose to 9.6 million in August, the highest level since April, the US Bureau of Labor Statistics reported yesterday. That's nearly 700,000 more than in July and well above the Dow Jones forecast of 8.8 million.
A strong labor market may indicate a growing economy, but why did E-mini S&P 500 futures fall to their lowest level since early summer? It's about the Fed's high rates.
A strong labor market makes the case for keeping rates high for longer to slow inflation to the 2% target. And high rates mean a decrease in the profitability of companies' businesses; accordingly, we see the development of bearish sentiment in the stock market. We wrote about this scenario in an analytical review on September 19, before the last FOMC meeting took place.
In addition, high Federal Reserve rates make bonds more attractive and portfolio managers, it can be assumed, are transferring capital from the stock market to bonds, as well as to cash (the dollar index hit a new high of the year yesterday).
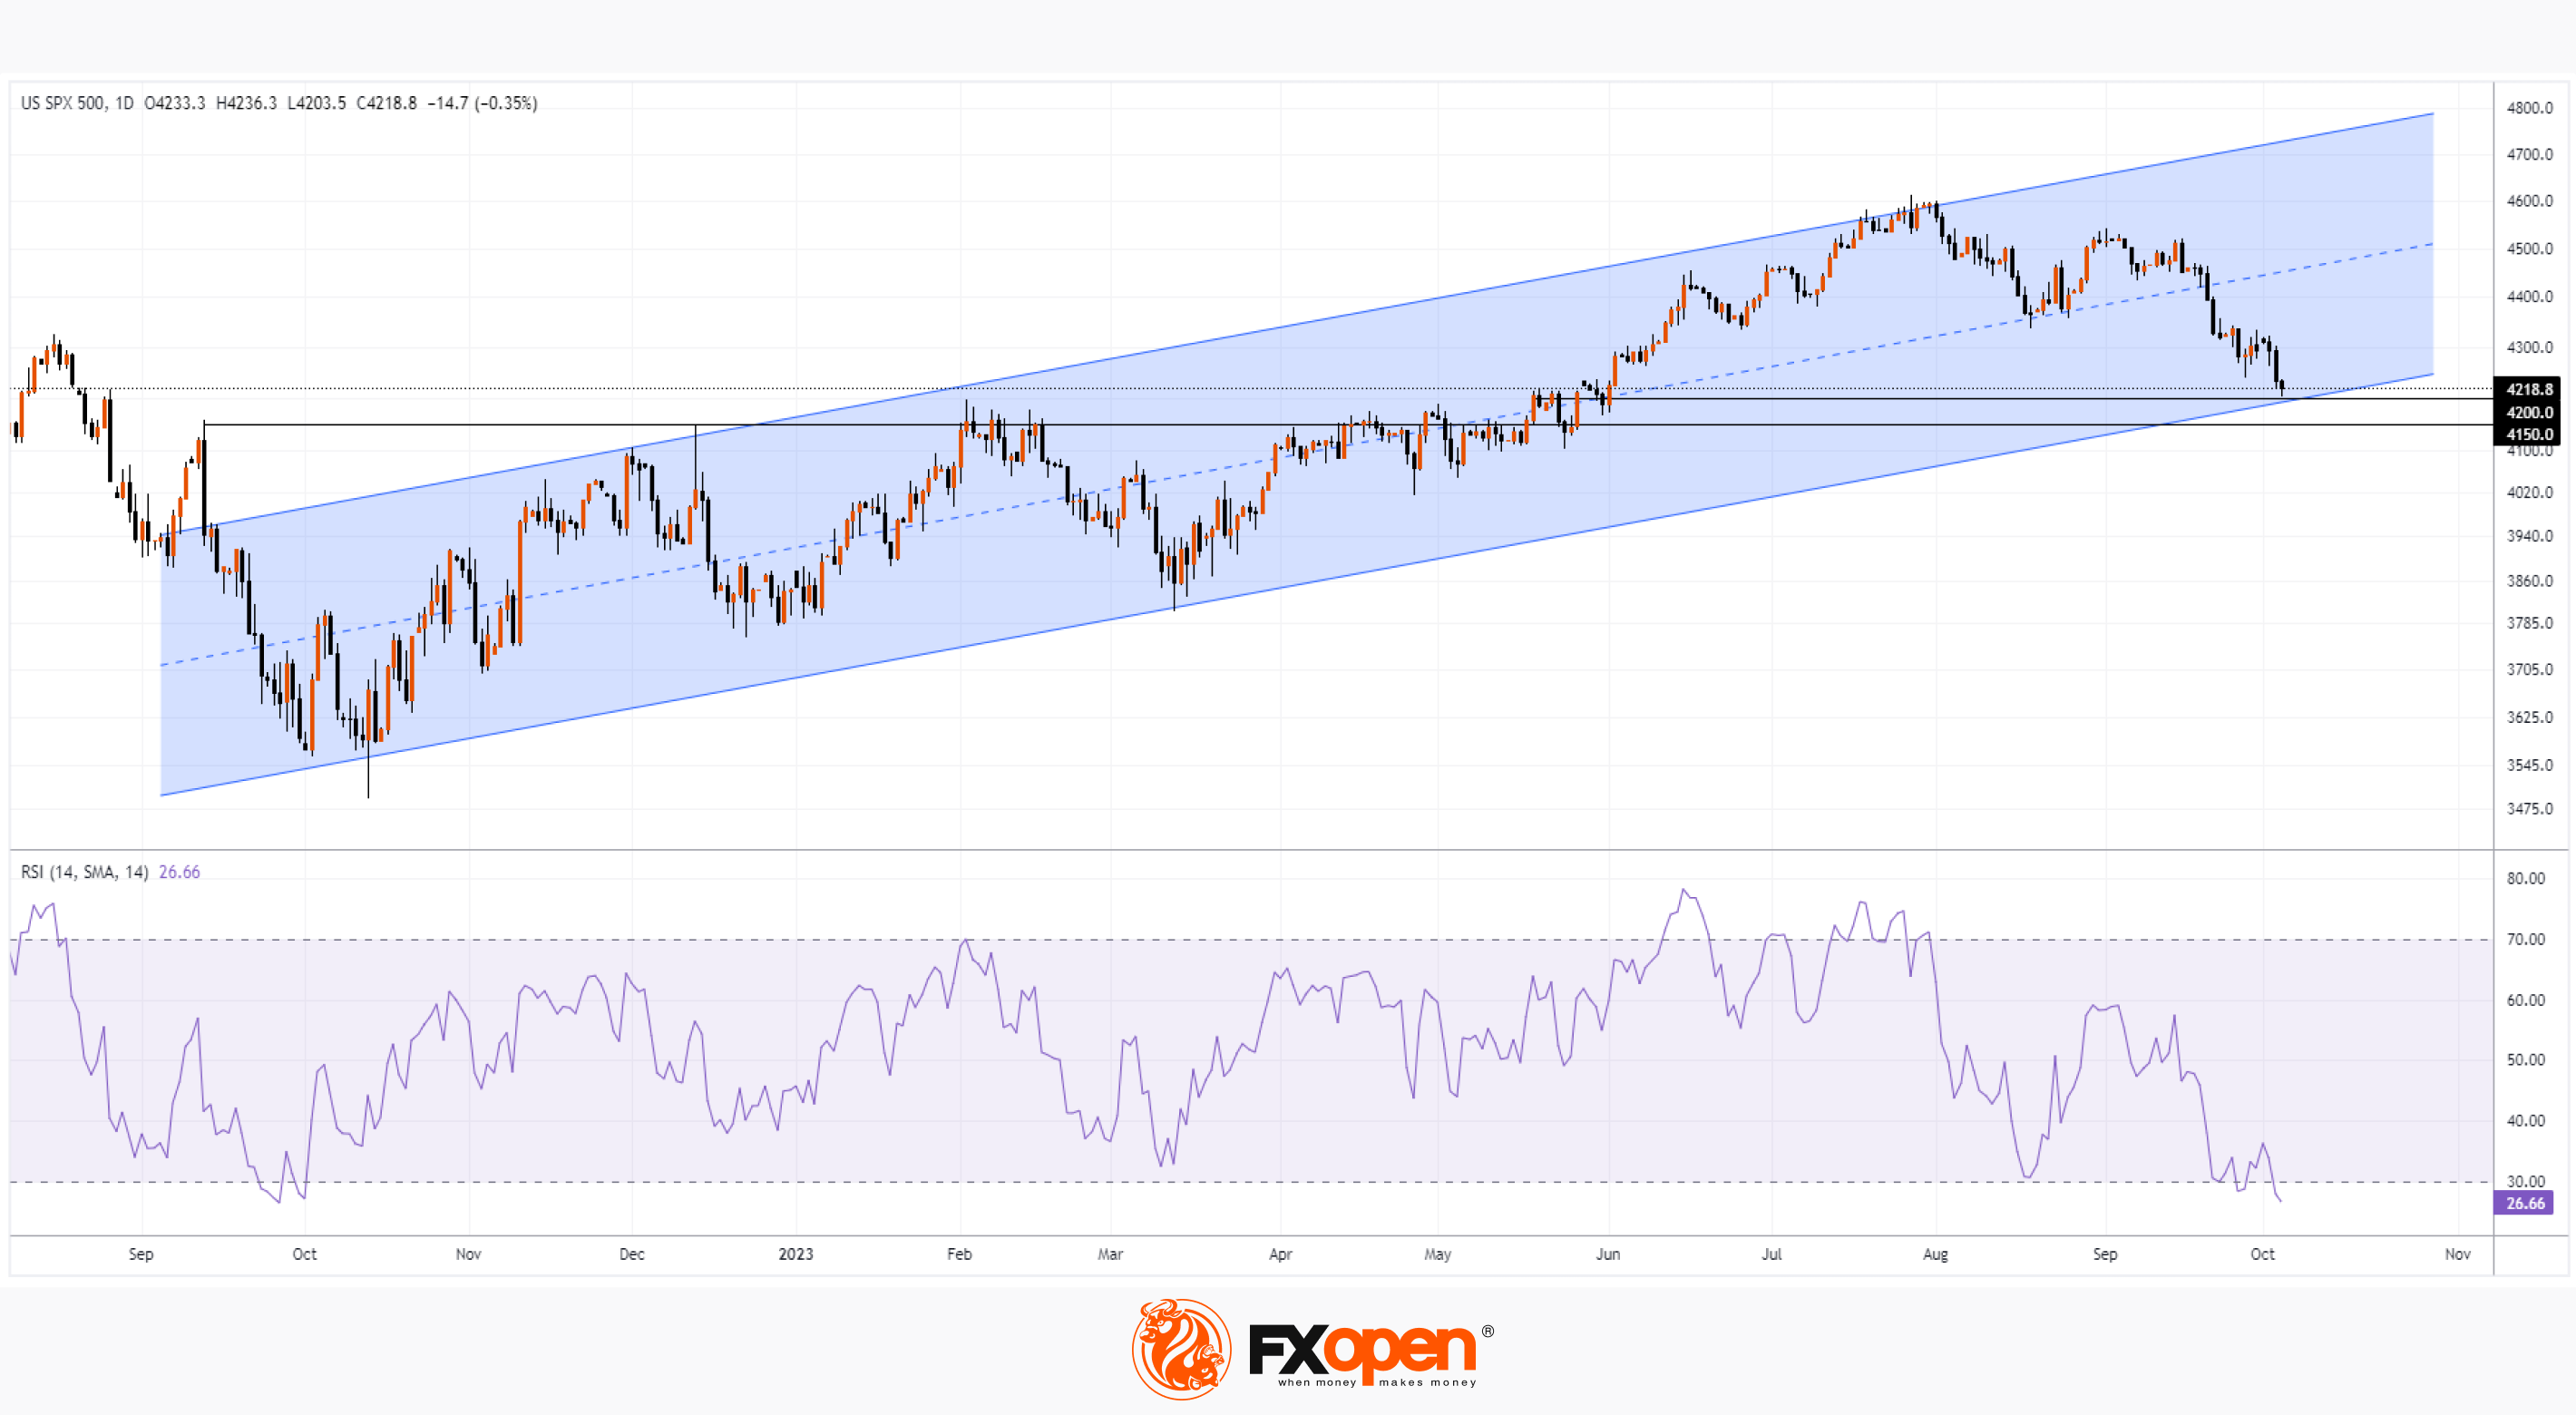
How long can a bearish trend in the S&P-500 market continue? The likelihood of at least a slowdown in the rate of decline is indicated by bullish arguments from technical analysis of the S&P 500 chart:
→ The price of the S&P 500 is near the lower border of the ascending channel (shown in blue). By the way, this line is part of a larger channel that originates from the bottom of the coronavirus panic.
→ The zone 4,150-4,200 can become a support for the bulls, since it has served as resistance since the fall of 2022.
→ RSI fell to its minimum in 12 months. This significant oversold market increases the likelihood of a rebound from the block of supports mentioned above.
Trade global index CFDs with zero commission and tight spreads (additional fees may apply). Open your FXOpen account now or learn more about trading index CFDs with FXOpen.
This article represents the opinion of the Companies operating under the FXOpen brand only. It is not to be construed as an offer, solicitation, or recommendation with respect to products and services provided by the Companies operating under the FXOpen brand, nor is it to be considered financial advice.
Stay ahead of the market!
Subscribe now to our mailing list and receive the latest market news and insights delivered directly to your inbox.


Latest articles

Consolidation Ahead of NFP: Commodity Currencies Search for Direction
Commodity-linked currencies have entered a consolidation phase following recent directional moves, as market participants adopt a wait-and-see approach ahead of key US labour market data. Current price action reflects a balance between ongoing demand for the US dollar and attempts

The Real Driver Behind the Dollar Rally: Market Insights with Gary Thomson
The US dollar has been firm, but the drivers behind the move may be more complex than they first appear.
While geopolitical tension and shifts in risk sentiment play a role, current price behaviour seems increasingly influenced by inflation expectations

EUR/USD and USD/CHF Pull Back: Market Reacts to Fundamentals
European currencies have shown a recovery in recent trading sessions after their recent decline, displaying early signs of a reversal. The US dollar is weakening amid expectations surrounding upcoming US macroeconomic data, while market participants are reassessing their short-term positions