


Market Analysis: E-mini S&P 500 Positive Ahead of Earnings Season
FXOpen

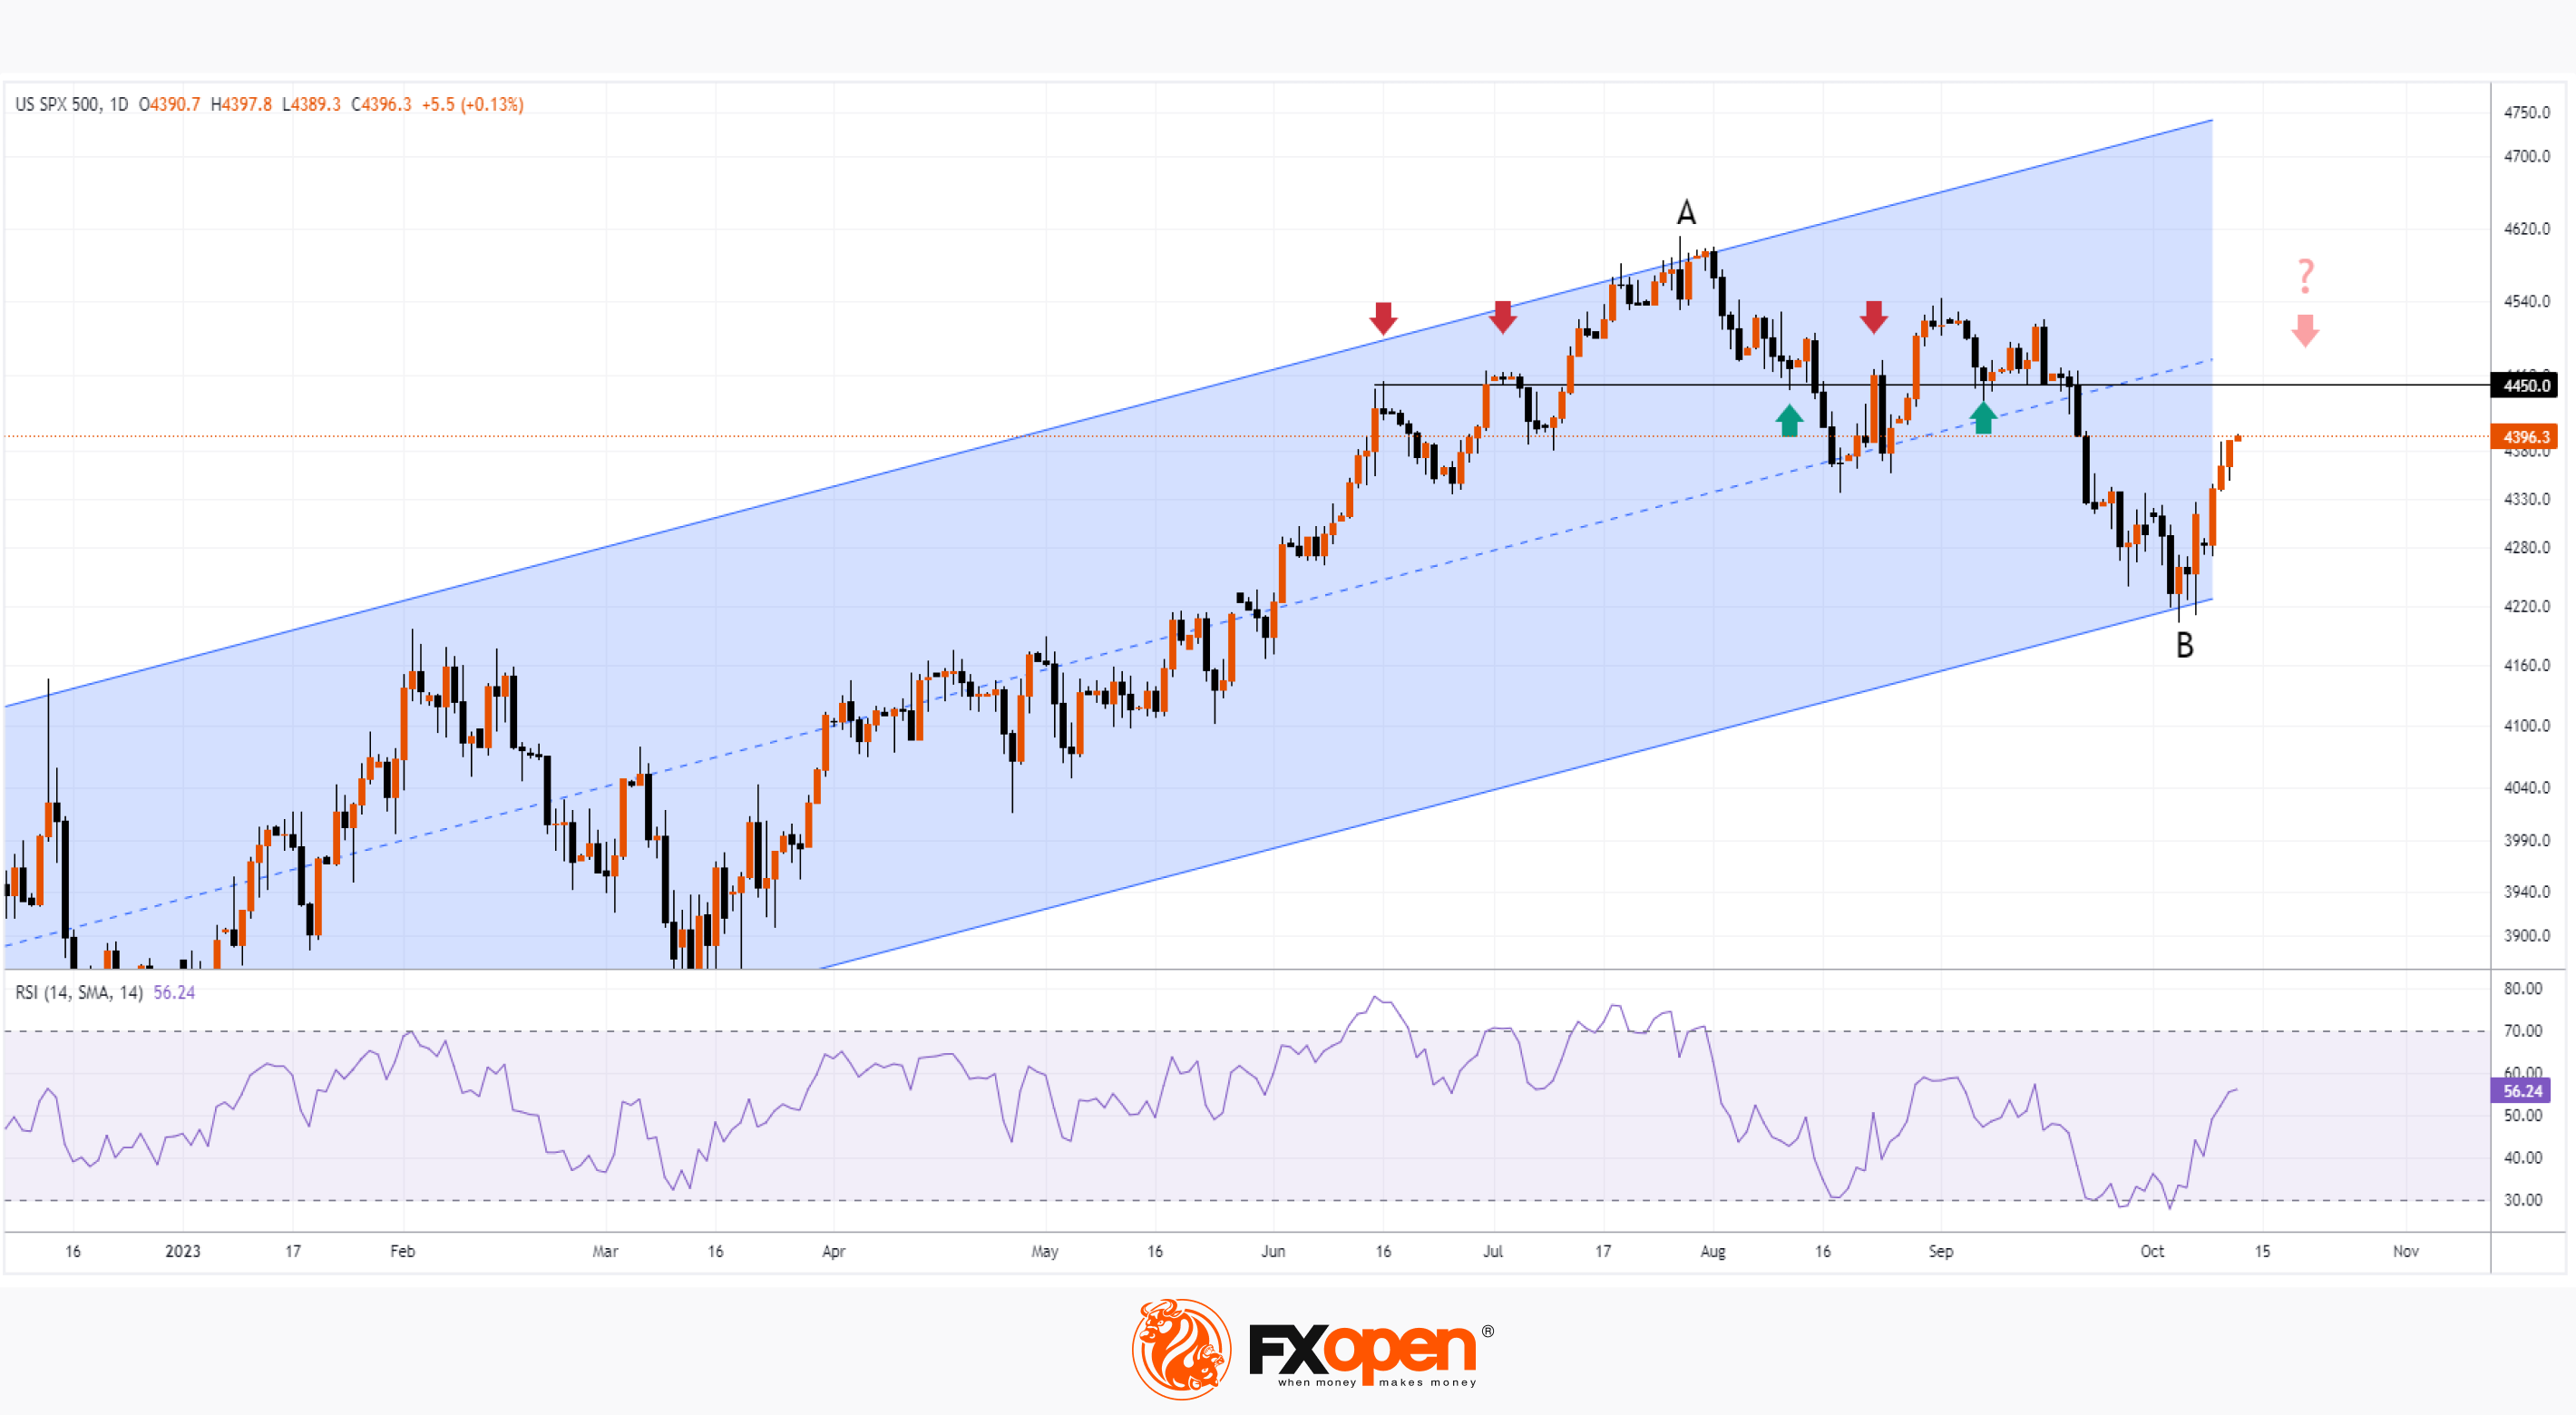
As we wrote in our October 8 market analysis, the S&P 500 chart made bullish arguments, including:
→ the S&P 500 price has reached the lower boundary of the ascending channel (shown in blue);
→ RSI fell to its minimum in 12 months.
Technically, these factors were justified, because today, the S&P 500 has strengthened, the price is near the psychological level of 4,400. Yesterday’s news also contributed to this:
→ inflation suddenly accelerated. The Producer Price Index (PPI) was 0.5%, although 0.3% was expected. The acceleration of inflation was influenced by the September peak in the oil market. But with the price of oil already back more than 10% from its peak, traders are not expected to be too worried about the PPI rise;
→ a "majority" of Fed officials thought another rate hike would "likely be appropriate" to help cool demand and bring inflation closer to its 2% inflation target over the next two years, while "some" said “no". “Participants generally noted that it was important to balance the risk of overtightening against the risk of insufficient tightening,” the minutes said.
As a result, as of Thursday morning, the price of the S&P 500 is at a high of the week, which indicates that, according to the consolidated view, the Fed is in control of the fight against inflation in a market that is experiencing positivity ahead of the reporting season.
Corporate performance will weigh heavily on the S&P 500 price in the coming weeks, with bullish momentum forming a rebound from the lower boundary of the ascending channel likely to be hampered by:
→ psychological level 4400, in the area of which Fibo 50% of the decline in A→B occurs;
→ level 4,450 – as the arrows show, it has affected the price more than once since June 2022.
Trade global index CFDs with zero commission and tight spreads (additional fees may apply). Open your FXOpen account now or learn more about trading index CFDs with FXOpen.
This article represents the opinion of the Companies operating under the FXOpen brand only. It is not to be construed as an offer, solicitation, or recommendation with respect to products and services provided by the Companies operating under the FXOpen brand, nor is it to be considered financial advice.
Stay ahead of the market!
Subscribe now to our mailing list and receive the latest market news and insights delivered directly to your inbox.


Latest articles

AI Valuations Are Back in the Spotlight
Artificial intelligence remains the dominant investment theme of 2026, but investors are increasingly questioning whether AI stock valuations are keeping pace with reality.
💰 Big Tech continues to invest at an unprecedented scale, with hyperscaler AI spending projected to exceed $800

AUD/CAD: Months of Indecision — Is a Breakout Finally Coming?
The Australian dollar has clawed back most of its end-of-June losses, when it touched three-month lows against the greenback amid escalating Middle East tensions. Since then, sentiment has improved: the RBA's Assistant Governor Sarah Hunter signalled the board stands ready

USD/JPY: Battling at the Top of the Triangle
On 3 July, Japan's Finance Minister, Satsuki Katayama, stated that the Ministry of Finance remains in close contact with US authorities regarding developments in USD/JPY as the yen traded near its weakest level in almost 40 years. Similar verbal